I’ve noticed despite not using Roon at all the past several days, memory usage is steadily increasing. In the past few days it’s gone from 4.6gb, to 4.7gb the next day, to 4.8gb the following day, to 4.9gb today.
I don’t know if this is new behavior or not. I have noticed for years that Roon steadily uses more RAM over time when I use it. Usually, it doesn’t impact apparent performance, though once in a great while Roon will become slow to respond and I’ll need to reboot to restore normal performance.
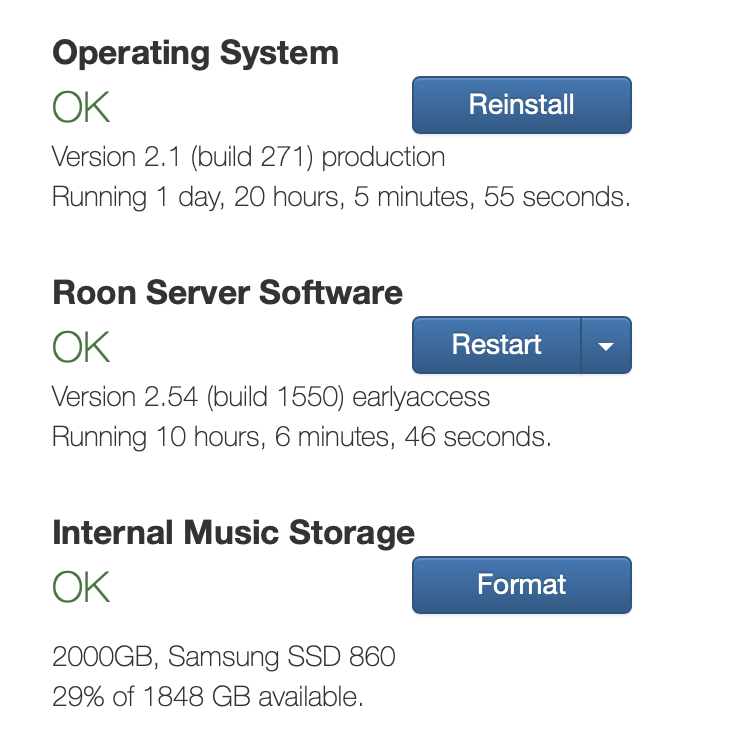
I’m not using EA (never have). I’m on the latest Production release, build 1544. Roon runs on my Salkstream; Arch Linux OS, 8gb RAM, i5 processor.
This strikes me as a really weird symptom of lack of memory, for whatever that is worth. I guess we will see if addressing the memory leak makes it go away.
The only thing that’s account specific is the network change event throttling to try to test my hypothesis about the leak remaining after B1547. All the other changes from B1541 to B1547 are active for everyone running the applicable builds.
None of the RoonAPI changes I’m talking about here are in production B1544, which is the most recent. Not to say that this isn’t a bug necessarily, just that these changes aren’t in that release, so I can’t say anything either way about it really.
It’s certainly not easy
As always, the hardest step is reproducing the problem: The thing that enabled us to make progress was learning that we could create a leak by turning a ChromeCast device on and off repeatedly.
This is a good one for me to keep in mind, thanks. We’ve been relying on memory profiling tools mostly, and generally having good results when we can manage to actually use them. We’ve gotten some profiles from user systems even, which is great.
That’s really good news
I think B1546 → B1547 fixed a more general/less environment specific leak, leaving (at least) one that happens when there are a lot of network change events. If your environment doesn’t have those (or I’ve set them to be throttled to once/day) then the problem might be completely fixed for you.
I would consider this positive result for my network change event hypothesis, because the last log line shows lower memory usage than the earlier ones.
That said, one of my main lessons from this experience is that it’s important to follow up on even very small upward trends in memory usage.
TL;DR: 1547 looks really good. The server-side fix doesn’t have an impact for me.
More detail in a second but do you mind reverting the change you made to my account to change the behavior in the context of network disconnects? I can see from my telemetry that it didn’t make a difference for either my EA or Prod instance and, given that, I’d like to keep my account in the same state as other users (no account-specific overrides). Thanks!
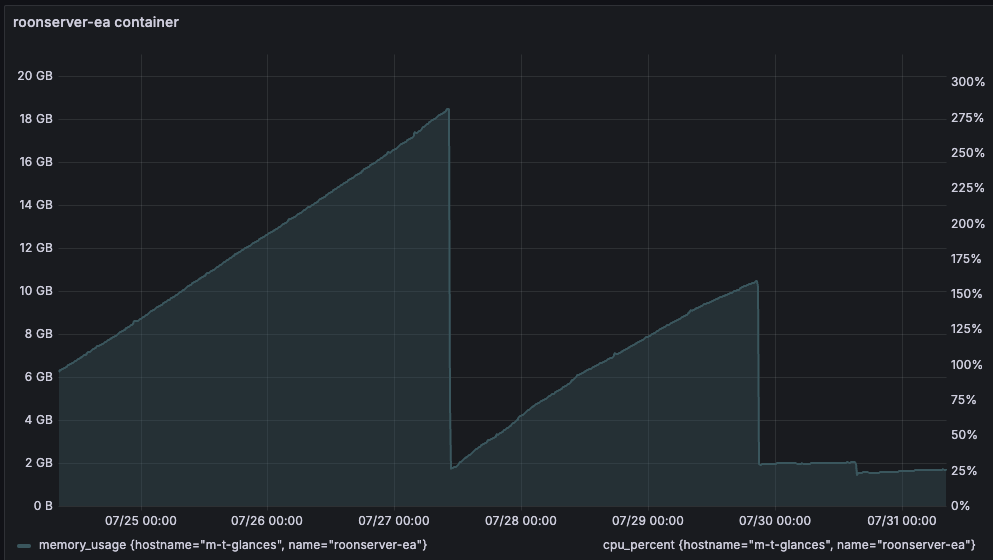
The fixes in 1547 appear to be (mostly) holding up in my EA instance. Here’s one week of EA. Every drop corresponds to a restart. The second large drop is the installation of 1547 and you can see that it’s almost flat. The slope you see before 1547 is what I’ve been seeing in production since I believe May. Prior to that, production looked very similar to what I see with 1547.
Within the 1547 range, there’s another restart with a drop. This may look to you like it was caused by the server side change you made for @Mr.Flibble and then for me. It’s not. I restarted after I read your post about the change and I wondered if it would help. You later clarified that it wasn’t applied to my account.
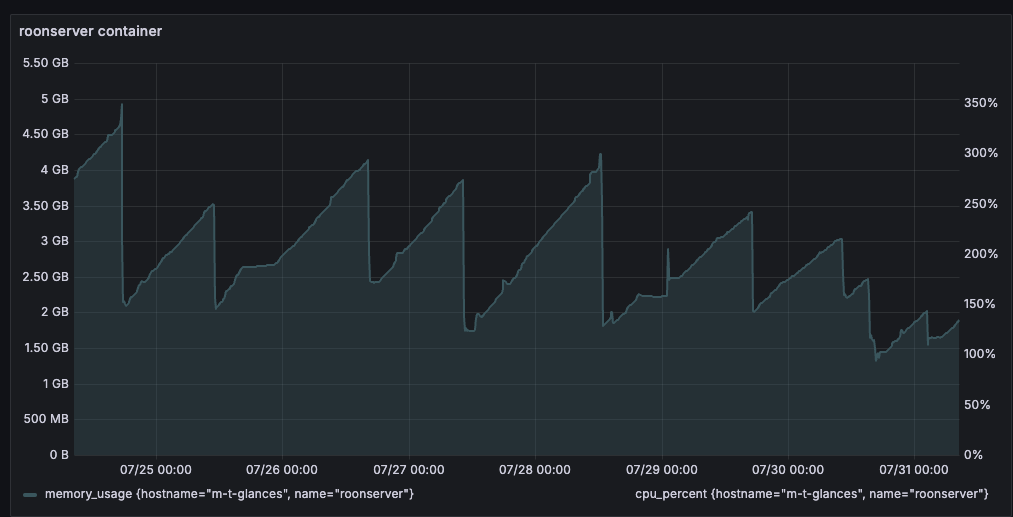
Here’s my Production instance for the same period. Each of the drops is, again, a restart and they all follow the same slope. The last bit is after the server-side change and you can see that it isn’t helping me.
Let me know if it seems to have resolved the leak problems. I’m not seeing leaks that are particularly detectable over time periods on the order of 24hrs on my side, but can’t rule out something slower yet.
Done, I’ve reverted this for both accounts.
I wonder why smart downloads leads to a long term increase in memory usage, that sounds like something I need to investigate at some point.
How about adding a review step for release notes into the release process? This is the second time in a row that the release notes seem to contain misleading/wrong information about the scope of the release:
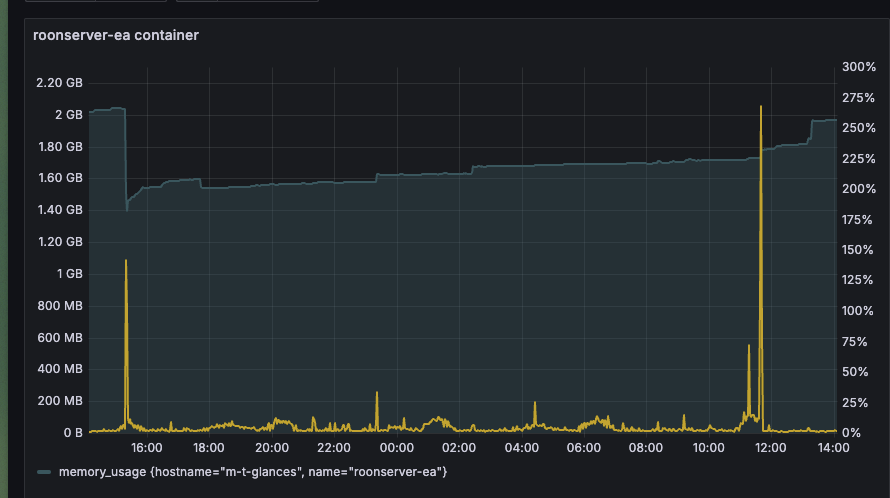
Here’s a 24 hour view of EA. The spike on the right end is the installation of 1550, which has been running for a few hours. It looks similar to 1547, which is what we’d expect.
I agree that there are no large, obvious leaks that I’m seeing. I’ll keep an eye on it over the weekend, assuming you don’t release to production before then.
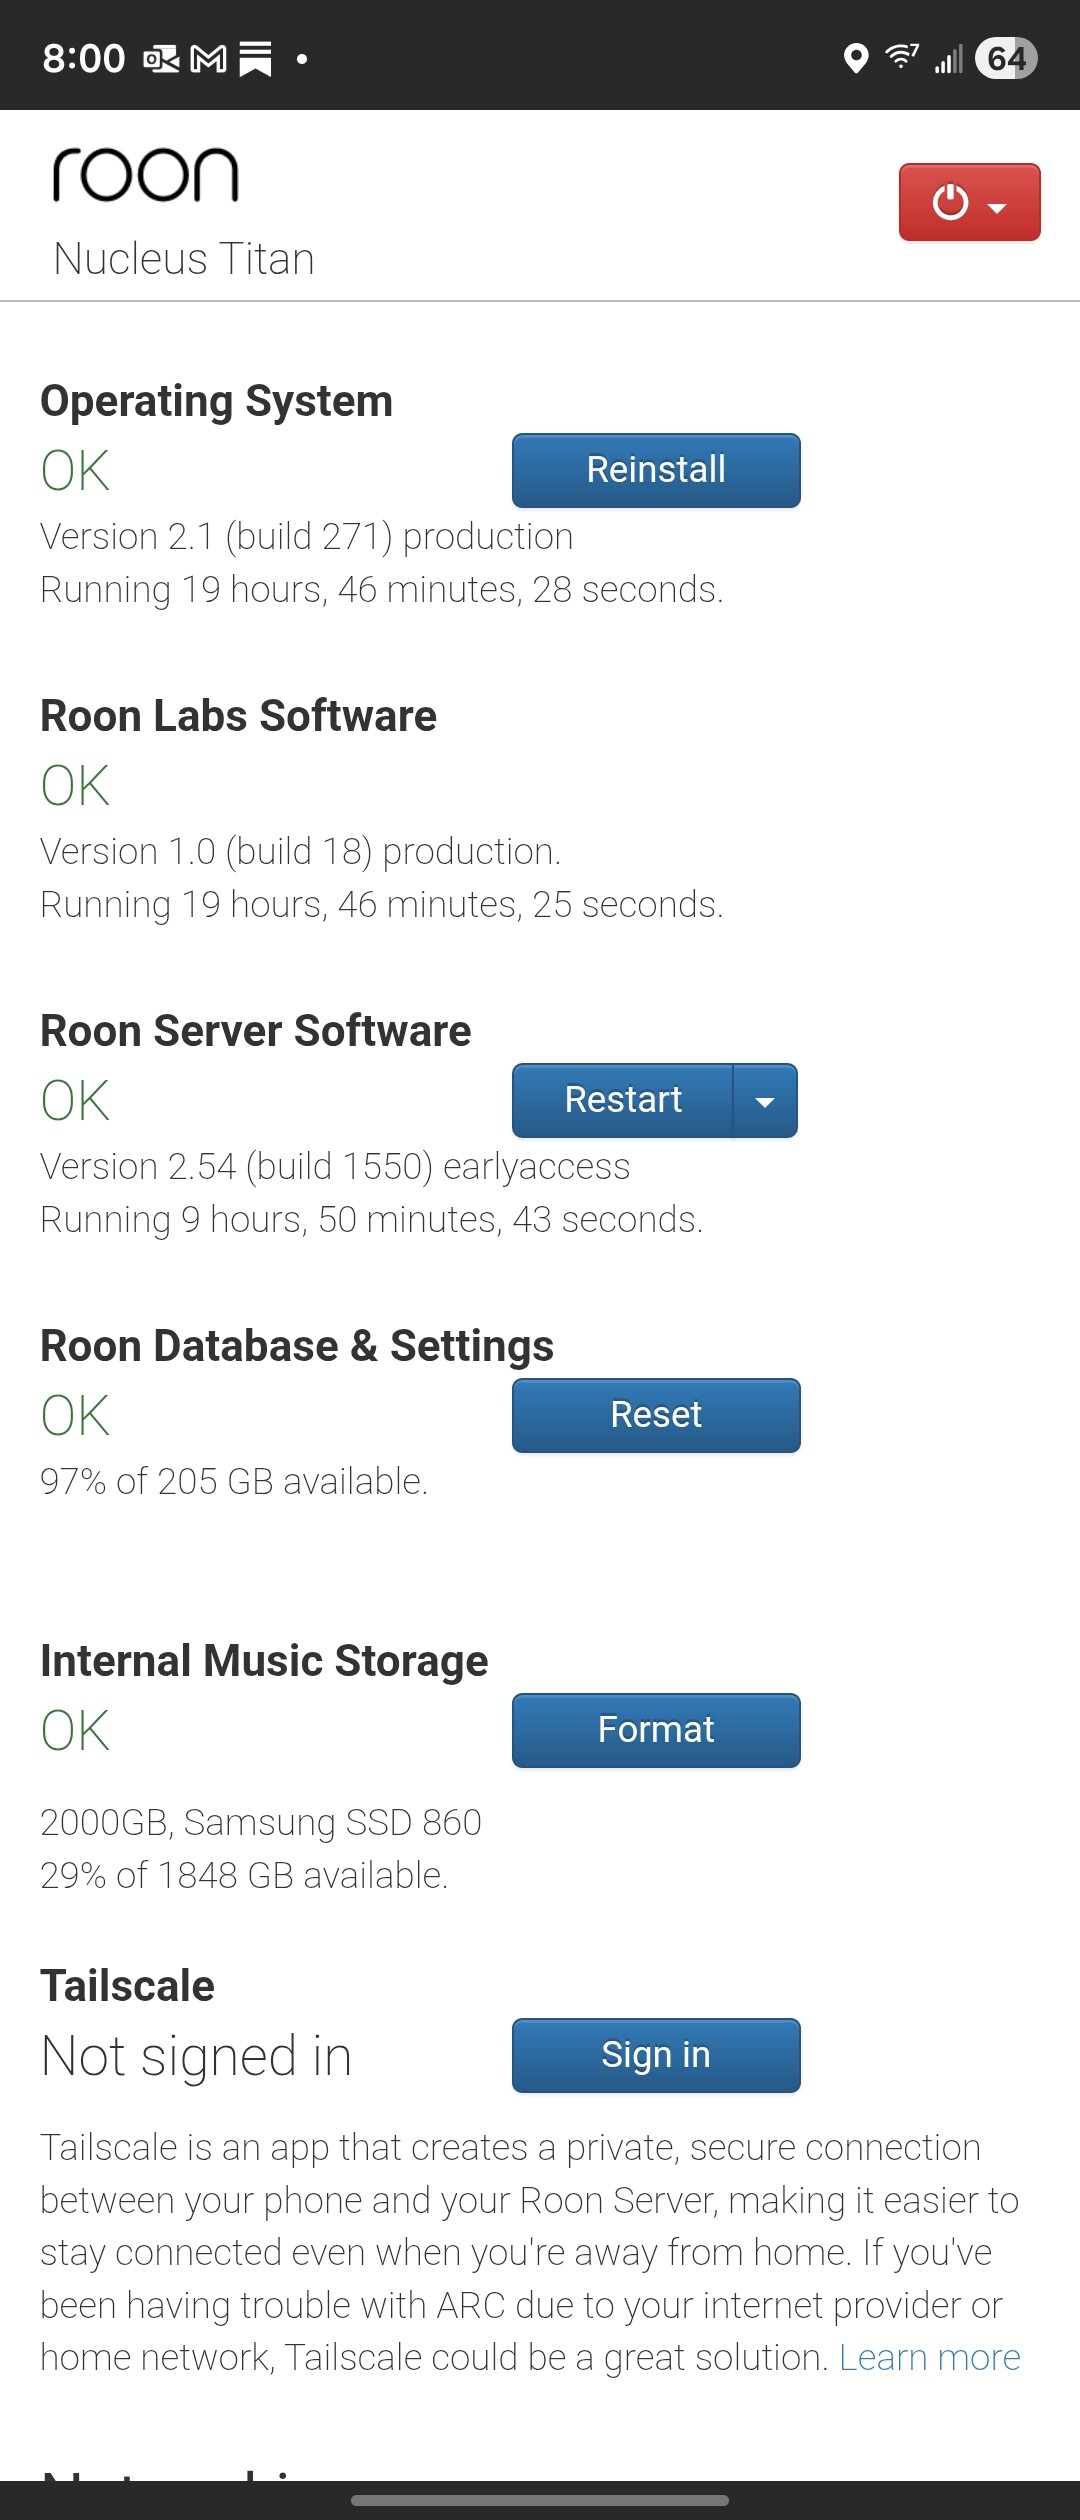
FYI, Ben, with the 1550 preview, installed on my Titan, it got through the first index without crashing, which is a first. (I can’t see the memory usage, of course.)
Searching my last Tidal playlist did work, and then reset worked. Right after the reset, it put up a “Wait…” panel and cleared the playlist fully (which was weird), but it didn’t crash.
That’s certainly a positive development. I didn’t run the server under the my Mac mini yet (on that platform, the server consumes Mach ports at a furious rate and never releases them until it crashes), but that was a “no choice due to crashes” switch, so we’ll see how the server goes over the next few days.
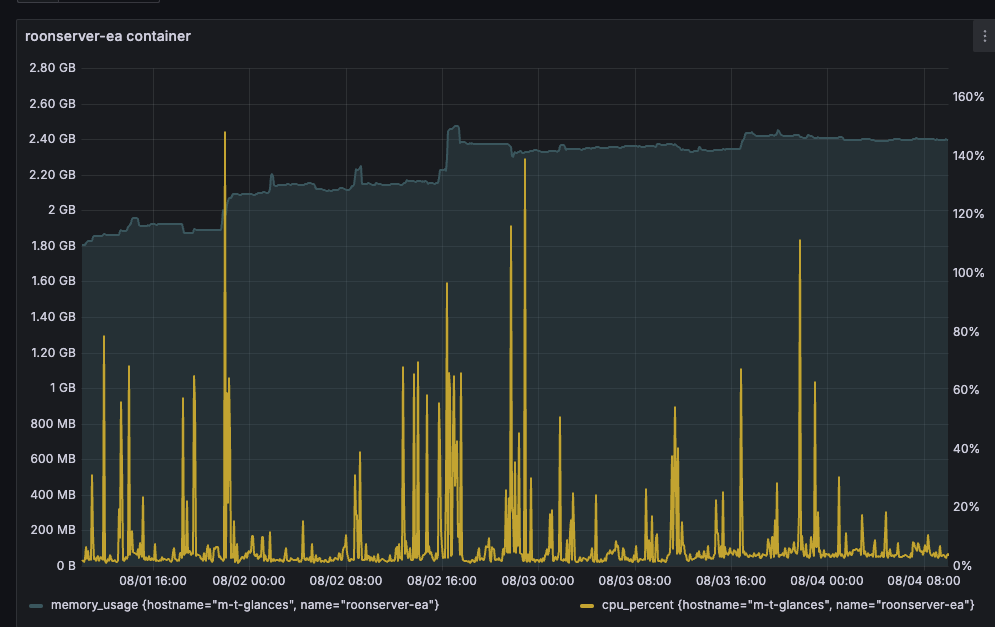
I just wanted to share an image of 1550’s memory use over the weekend. Here’s 3 days of use. There have been some step functions up of memory use, which you probably understand better than I do, but no real evidence of a substantial memory leak.
I know there are additional outstanding issues but this build looks very good to me.
It certainly sounds like it would be good enough for a production build if it wasn’t those pesky Chromecast and Airplay issues, but I don’t have any of those devices
I also have been having more issues as of late but don’t know if that was due to change from Windows 10 to 11, or latest Roon builds.
Never had an issue with my NUC7PJYH with 8GB for several years even with my local 40-45k library. I re-built my library a few days ago with regular production builds on all desktops/tablets/phones from scratch and just opted for Tidal and not my own local library, yet still run into issues. I’ve ordered more RAM to double it to 16GB. Hopefully, that helps resolve some issues.
Network is wired. For example, zero issues with it as Plex Server with 4K HDR high bitrate files.
Just going to follow up. Upgraded from 8GB to 16GB like 3 days ago and also power cycled all the network components at the same time (don’t think it made any difference, but why not). Immediate improvement in usability in both Roon and Roon ARC. It’s almost as fast as in the old days (1.8 and before). RAM does ramp up over time. Right now running just Tidal. Will add local library and observe. Eventually will jump back to Early Access if it runs well.
There is still the odd occasional issue of Roon remotes on iOS when they are opened for the first time in that the endpoints temporarily disappear for a few seconds and come right back (although this would take much longer before). Perhaps a better CPU like a M4 Mac would resolve this entirely.