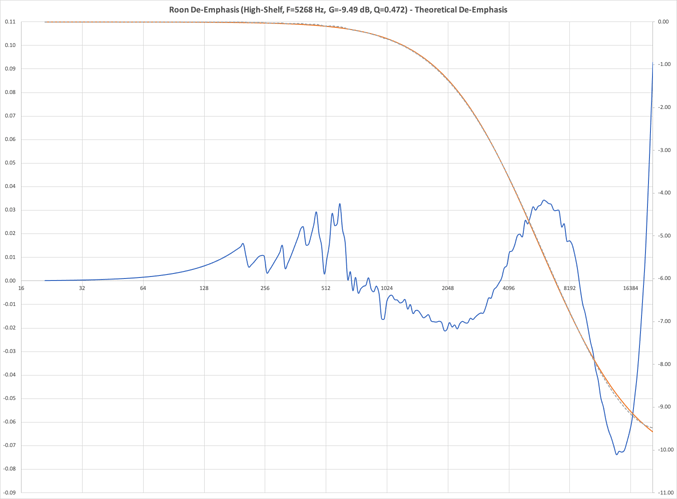
A slightly more careful and high-sample point calculation yields:
F = 5268 Hz
G = -9.49 dB
Q = 0.472
and the discrepancy plot:
Notice that there’s “noise” in the data (eg oscillations around 400Hz). This is caused by the crude - albeit quite powerful - method of capturing the data from a screenshot (I have no way to get Roon’s filter values out other than a screenshot and using WebPlotDigitizer to estimate numerical values). So the real discrepancy is a smoother rolling average.
Also note that the increased discrepancies around 15KHz and 20KHz are still very small in relative value: 0.7dB/9dB which is less than 1% discrepancy
