Hi @DrPo,
The following is just for your peace of mind. (It really is a useless experiment, as its outcome was predictable before even starting it  ).
).
I tried to re-do their measurement; the one that caused them to believe that Roon applies some sort of ‘filtering’.
Nothing fancy, but just performed ‘well’ this time. Without real professional equipment, but with proper thinking.
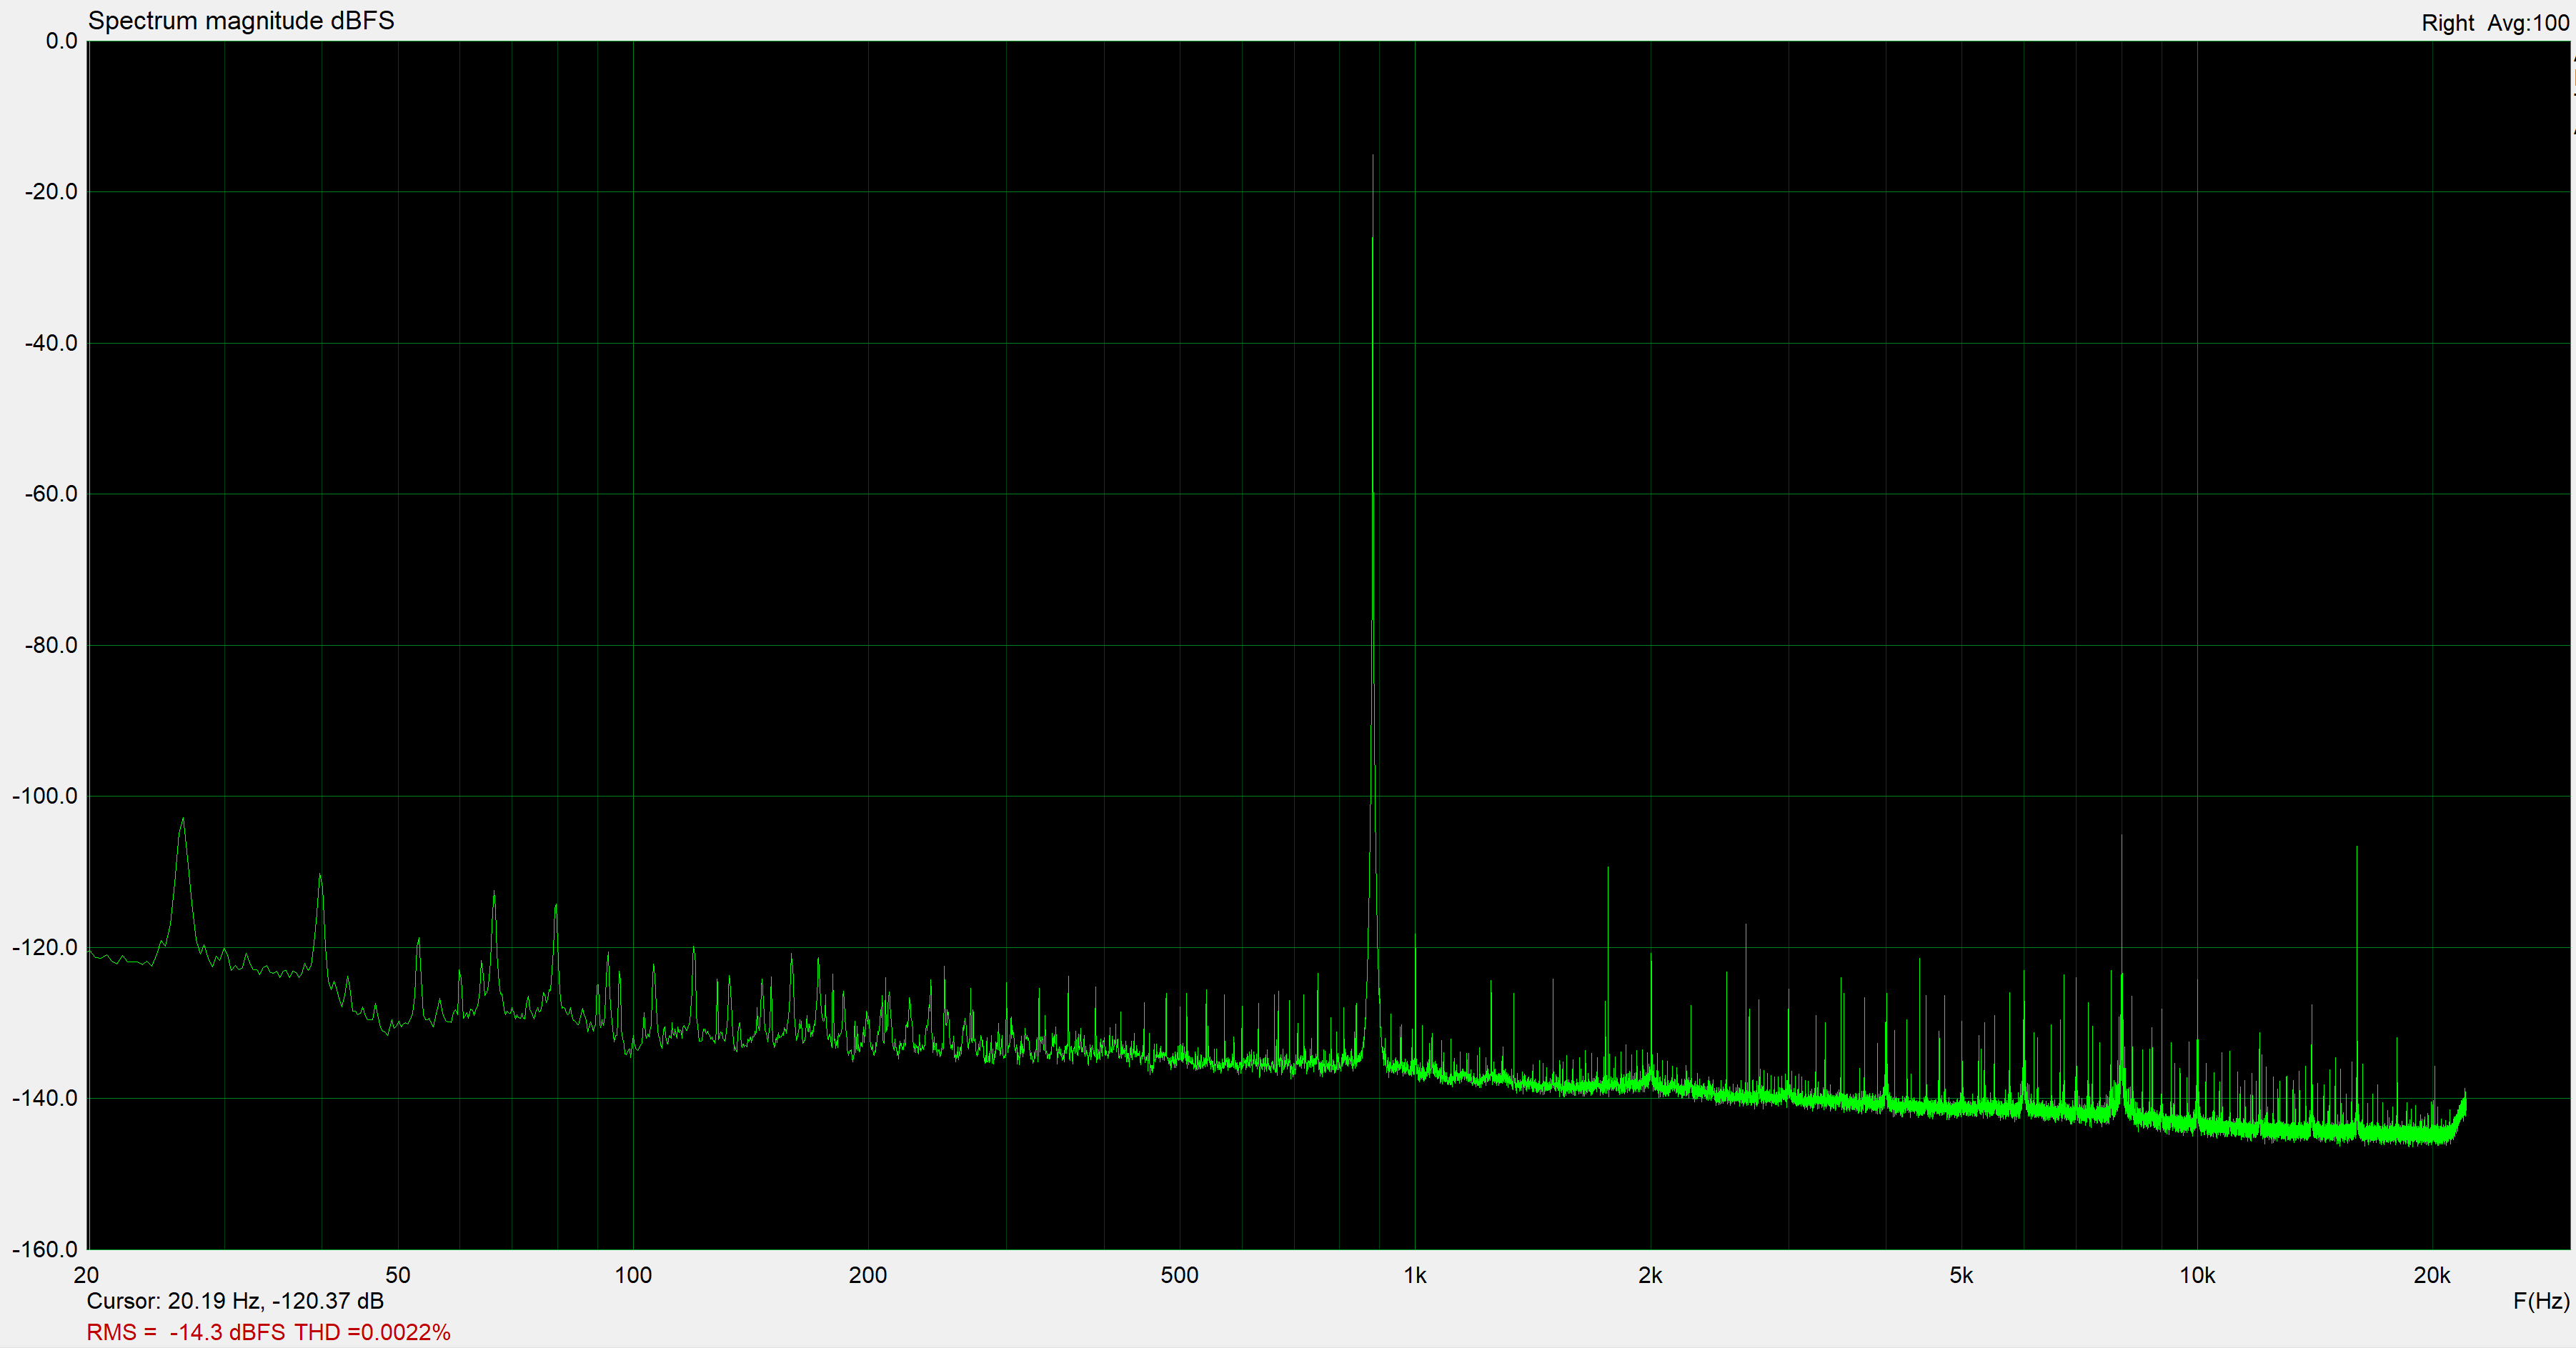
What you see below, is a 24 bit 44.1kHz WAV file. The file only contains a 882Hz sine wave, like they did, at 0dBFS (that means : as loud as it can possibly be).
That file is played back by Roon, indicating lossless. Output device is a semi-pro Audioprobe soundcard (DAC).
This output is then fed to another semi-pro Focusrite soundcard (=ADC), performing as the measurement device.
Cable between the two is a 5 meter jack-jack cable, normally used for electric guitars  .
.
The signal received by the ADC, is then spectrum analyzed with Arta software. FFT size was 131072, and a whopping 100 (!) takes were averaged to give as much as detail as possible.
(An observant reader will notice : Hey, your pic does not show the signal at 0dB/full scale. Why ?
You’re right - I had to lower the analog gain about 10dB, in order to minimize the distortion caused by the measurement itself.)
Click the picture; the downsizing of the forum makes it hard to read.
What should be immediately obvious, is at least the following :
- There are no ‘bumps’. No evidence for what they called ‘filtering’.
- This measurement shows an awful lot more detail. You can in fact see the distortion products of my playback and recording devices (summed). Those are all the narrow, but well-defined spikes.
Admittedly, distortion is very low (0.0022%), but at least you can clearly see it. In the linked measurement : all info was lost, and went way below the noise floor.
What good is a measurement, that drowns all of its relevant information… ?
- It is much less noisy, too. Fairly well-defined, thin lines. As opposed to the vertically scattering line in their pic (esp. at higher frequencies)
- My measurement contains proof, that the equipment can actually measure in a dynamic range of approx 120dB (in fact a bit more, but that’s not visible here), It contains both very loud, and very silent details.
The article’s pic shows only about 20-30dB of range in this specific measurement. I wonder how that could ever be of use.
You should also know, that if I apply downsampling (and thus lowpass filtering associated with that) ON PURPOSE in Roon, this picture hardly changes at all,
Yes, I can see that proper filtering is applied in that case. Effects on the noise floor are minimal (can’t be fully avoided), and nothing like in the linked picture.
Summarizing : despite the fact that my measement is much, much, múch more detailed, it in fact shows LESS evidence of said misbehavior. Or any evidence of it, at all.
 .
.