macOS Catalina interface laggy randomly while running Roon (High GPU usage randomly, Roon idle 20% GPU, sometimes up to 99% usage) [Resolved in Roon 1.8]

Also testing the update with crossed fingers! Currently testing the interface that has had the biggest resource impact (Album Detail Page) and CPU is around 15-20% and GPU is hovering about 45-50%.
So given the changes were experimental I think we can’t expect a full fix (as especially GPU is still quite high) but, for the last 5-10 mins at least, it hasn’t gone any higher on my Macbook Pro 2020 running the remote. So I think we are on the right track!

I’ll replicate it on Mac Pro 2013 and report back.

Regardless, thanks for the ongoing efforts and attempt to address this issue guys! @dylan @noris

Cheers,

2 Likes

testing with the Roon remote in full screen in the iMac 27 2019, still behaving after 10 mins of clicking around.

had a 41.7% spike while browsing an artist page, got back to overview, looking good:

On the Remote (MBPro '20, 3440x1440 screen):

  • GPU stable around 40-45%, CPU ~15% when Roon is maximised on a Desktop space looking at Album Detail Page
  • Interaction like scrolling up and down the page brings GPU to 55-60% max

On the Core (MacPro '13, 2304x1296 HiDPI):

  • GPU stable around 11-12%, CPU ~7% when Roon is maximised on a Desktop space looking at Album Detail Page
  • Interaction like scrolling up and down the page brings GPU to 30-35% max

Peaks are scrolling up and down while the album is playing.

Additional stable GPU impact/demand figures from the Remote on idle:

  • Overview page : 0%
  • Artist Detail Page : 0-5%
  • Album Detail Page: 35-45%
  • Albums (start of the list, 80 albums showing on a single page): 20-30%
  • Artists (start of the list, 60 artists showing on a single page): 20-30%
  • Now Playing: 0%
  • Queue:15-20%
1 Like

Very similar to what I am seeing here, haven’t been able to break it, I did tried full screen and maximized window, still stable.
Encouraging!

1 Like

Indeed!
One very curious thing is, the moment the album that’s playing finishes and radio starts, (or you are just looking at a different Album Detail page than the one playing) the Album Detail page GPU consumption drops to 0-2%, CPU consumption more than halves… So this resource is only required when that album you are looking at its detail page is playing…
Why though?
This makes me think there’s some sort of feedback loop required to see if the track highlighted (+ a tiny animation) needs to change maybe? Because that’s the most obvious thing different between these cases. Why would it need that much resource to do that is a question for Roon fellows though…

Regardless, my confidence levels are increasing with every minute that I may not have to baby Roon app any more (maybe I still need to if I’m on battery on Remote) to make sure it’s not going to damage my hardware if left to itself on the Core.

Great work, Roon team! Your continuous open comms about the assumption raised above would still be appreciated :slight_smile:

Cheers,

yeah… if you just want it to go down to 0-5% GPU usage just go to the overview page.
I feel this is normal enough!

hope this gets ported to further releases so we won’t face the issue anymore.
once again thanks @noris @Dylan

1 Like

I’m looking at 50% GPU usage with Roon B610 on Macbook Pro 13" 2020. Consistently happens in the album details view, but I’ve seen it on pretty much any screen when music is playing.

Good to hear it’s not only my MBP 13" 2020. I have a suspicion it’s the animation when the page needs to display a now playing indicator next to the playing track.

As a reference, using the Macbook Pro 13" 2016 as a remote simultaneously, shows only ~ 11% GPU usage. The 4 year old laptop with integrated graphics is using 5x less gpu.

looks like the GPU usage was throttled somehow to acceptable levels, in my case 0-41.7% spikes depending of the context page I am browsing, if compared to the resource usage of other of my Mac computers, Roon still needs extra optimization for some particular HW.

At least I am happy now that I can use it in full screen without having to worry about the GPU issue.

Hi everyone!

We appreciate the feedback you’ve provided on the changes introduced in Build 610. I spoke with the development team about this with the hopes of being able to provide some further insight into the changes that were made, as well as the work that is still to come.

The findings from our investigation

Through the acquisition of hardware, in-depth QA testing, and investigations into customer-reported issues, we’ve made a lot of progress in understanding some of the reasons that this high utilization is occurring, but this remains an open investigation.

The most important thing to understand from our investigations up to this point is that this is not one singular issue resulting in high resource utilization. Rather, there are a few issues that can, together or separately, manifest in high CPU and/or GPU usage.

Some of these appear to have resulted from changes to macOS or Apple hardware over time. Obviously Roon needs to be made to work in Apple’s constantly changing environment, but it can sometimes take time to figure out what they have changed and why.

What changed in Build 610

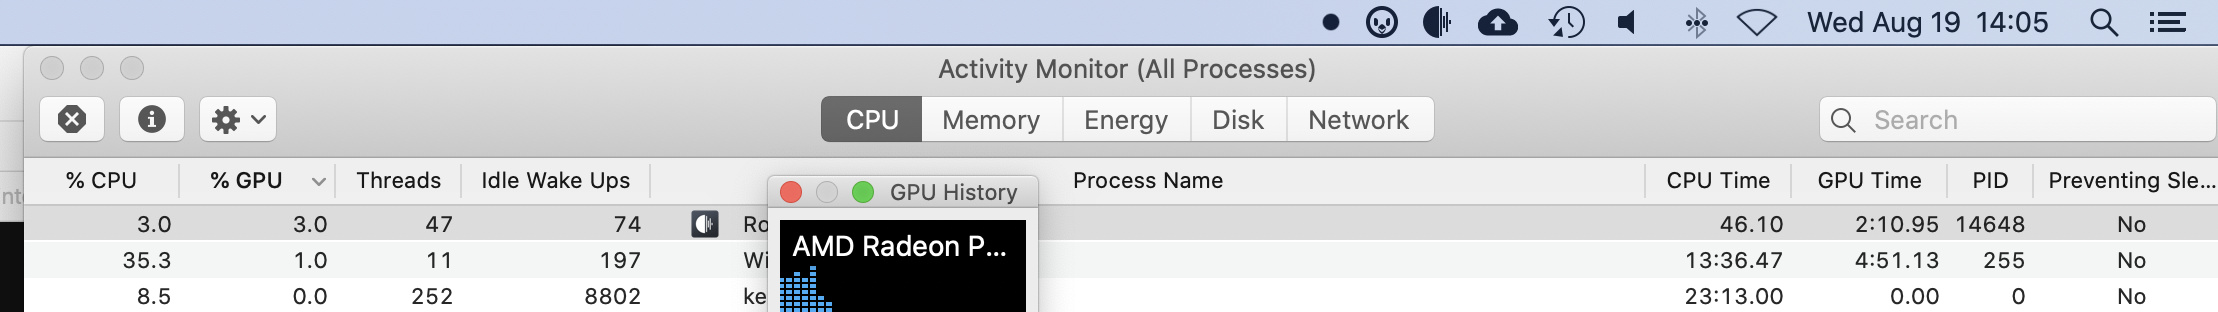
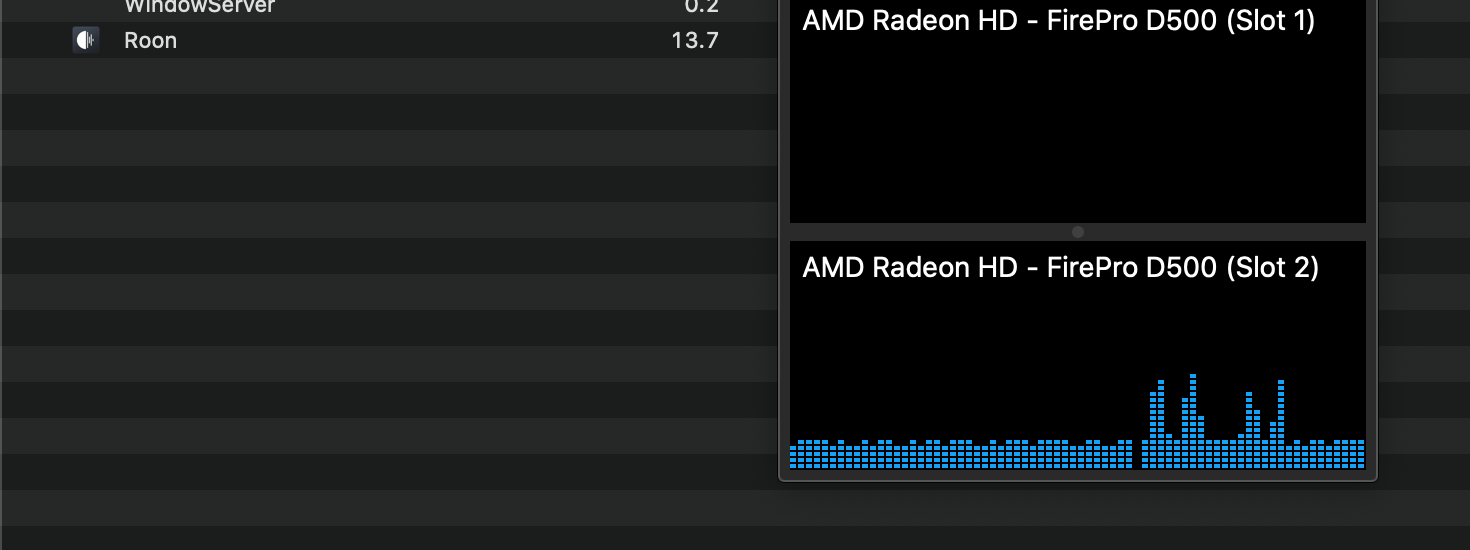
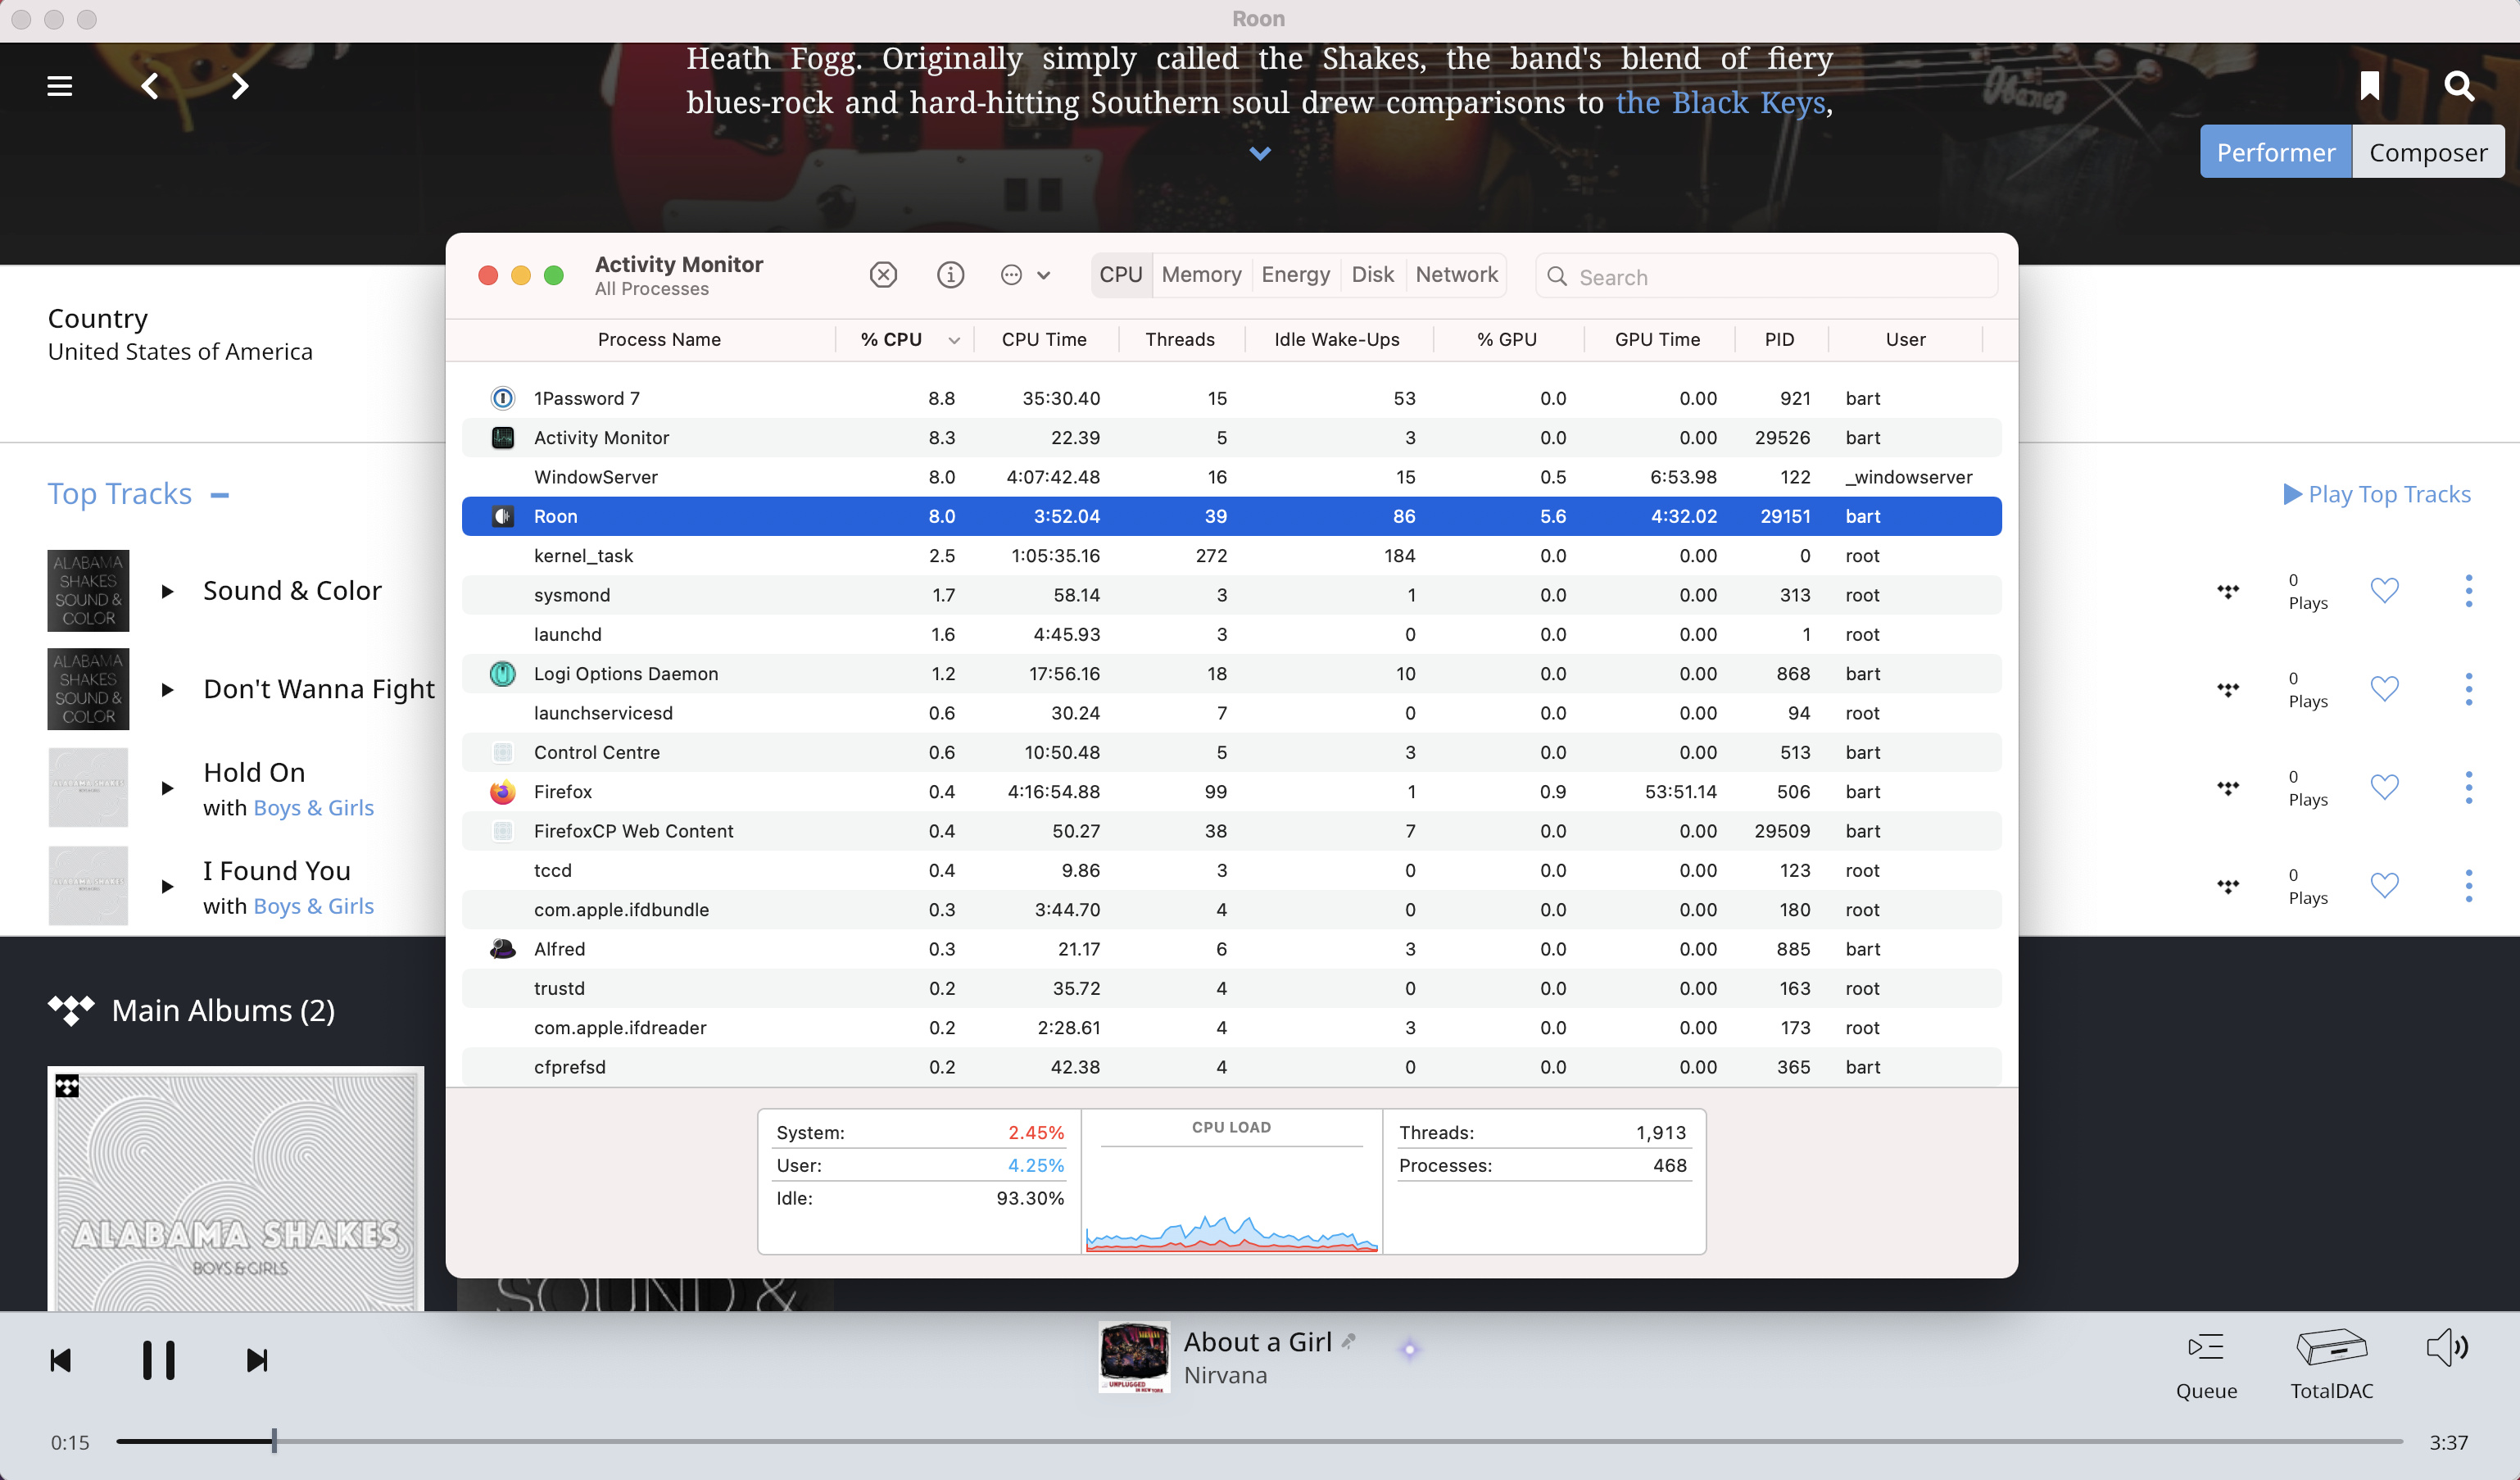
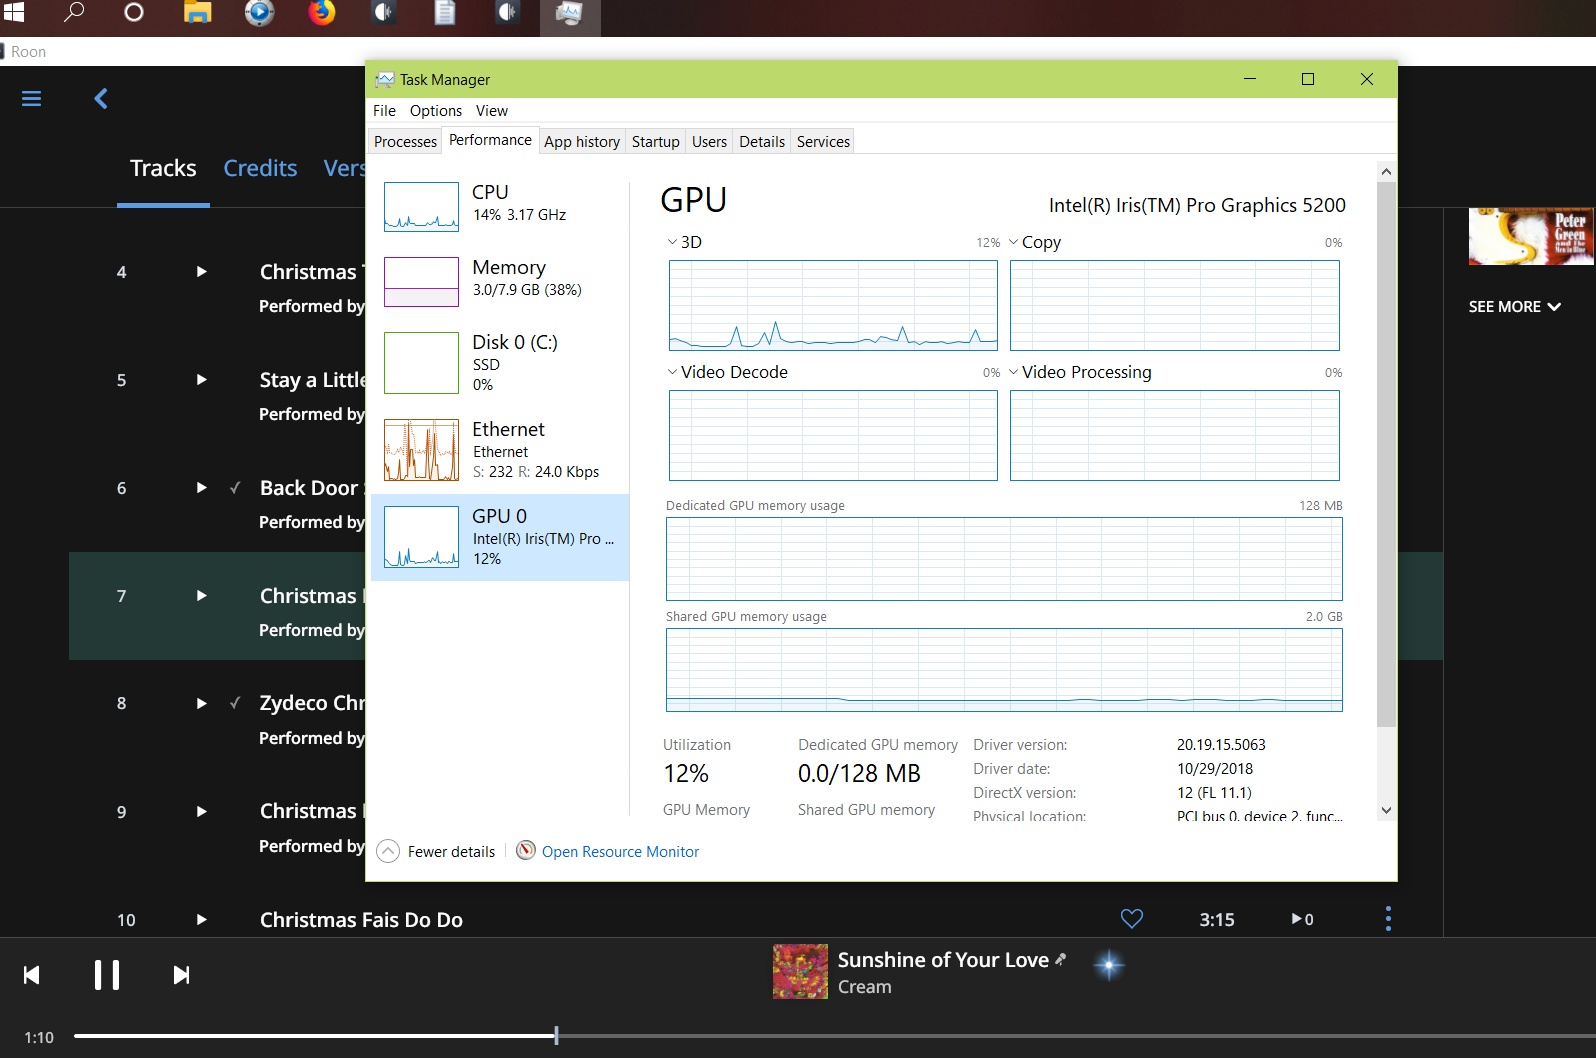
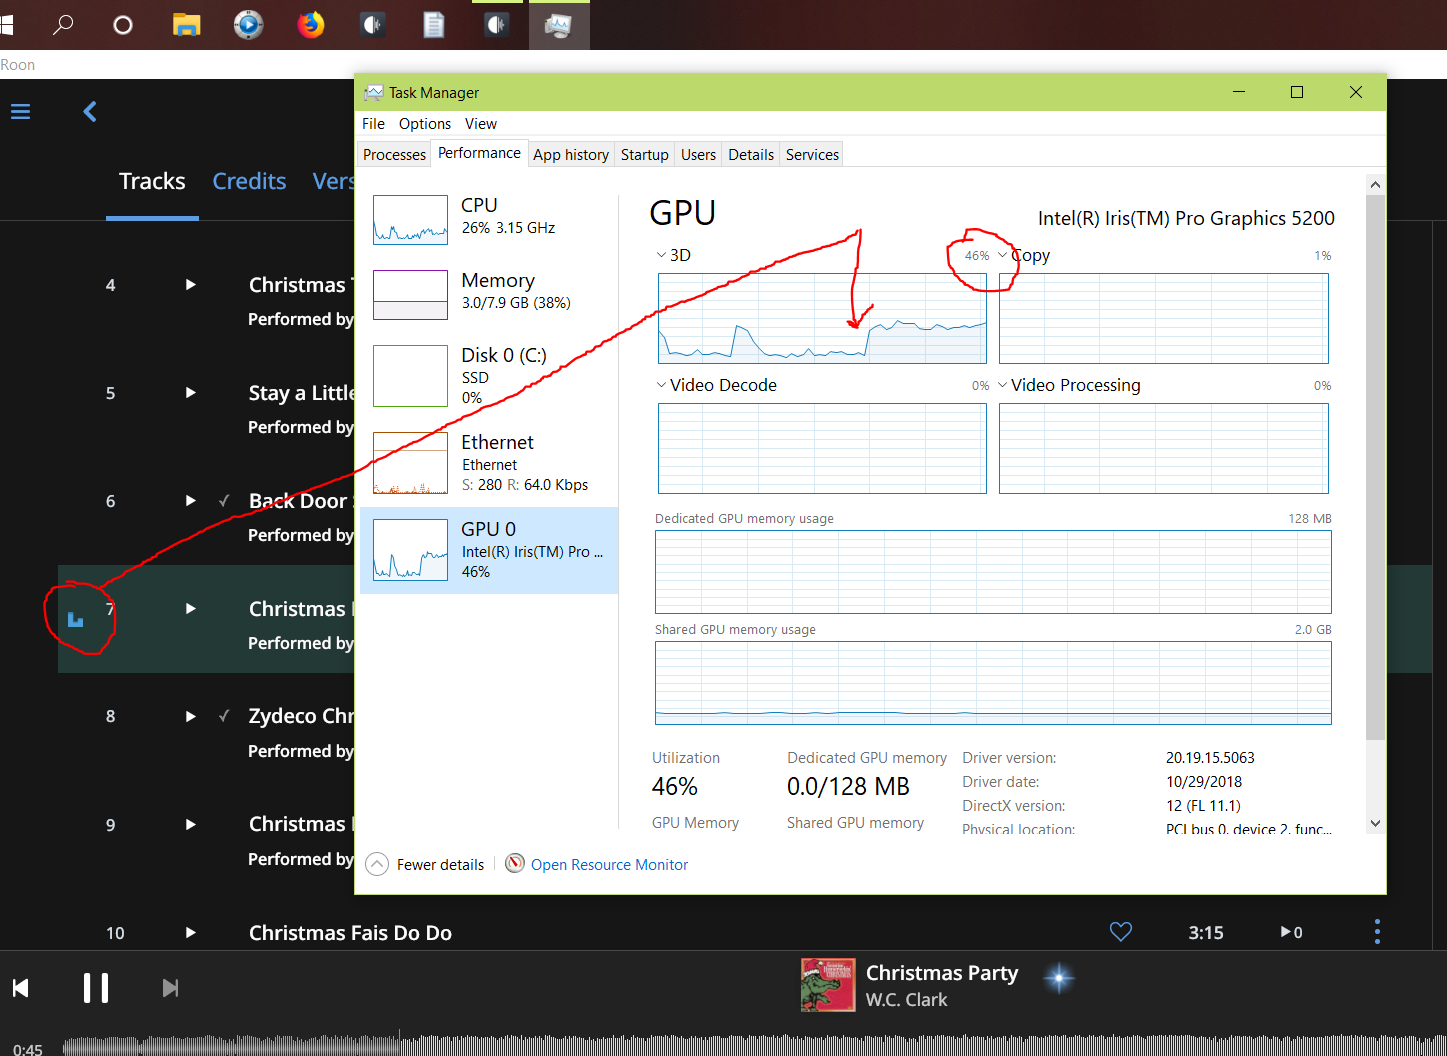
Build 610 contains some mitigations for potential causes of the high GPU utilization reported by certain users.

In alpha testing (and now release), it looks like one mitigation in particular is helping to reduce the most severe GPU utilization issue. This particular mitigation introduces an additional mechanism to synchronize graphics operations with monitor refresh, independent of traditional vsync. We have not uncovered the reason(s) why vsync appears to be buggy on these machines (we have yet to reproduce this specific condition internally) and are continuing to look into this.

Independent of changes intended to target this specific set of issues, Build 610 also includes optimizations intended to reduce graphics-related CPU/GPU utilization in general, as well as to reduce Roon’s consumption of GPU memory and GPU bandwidth.

What is still to come

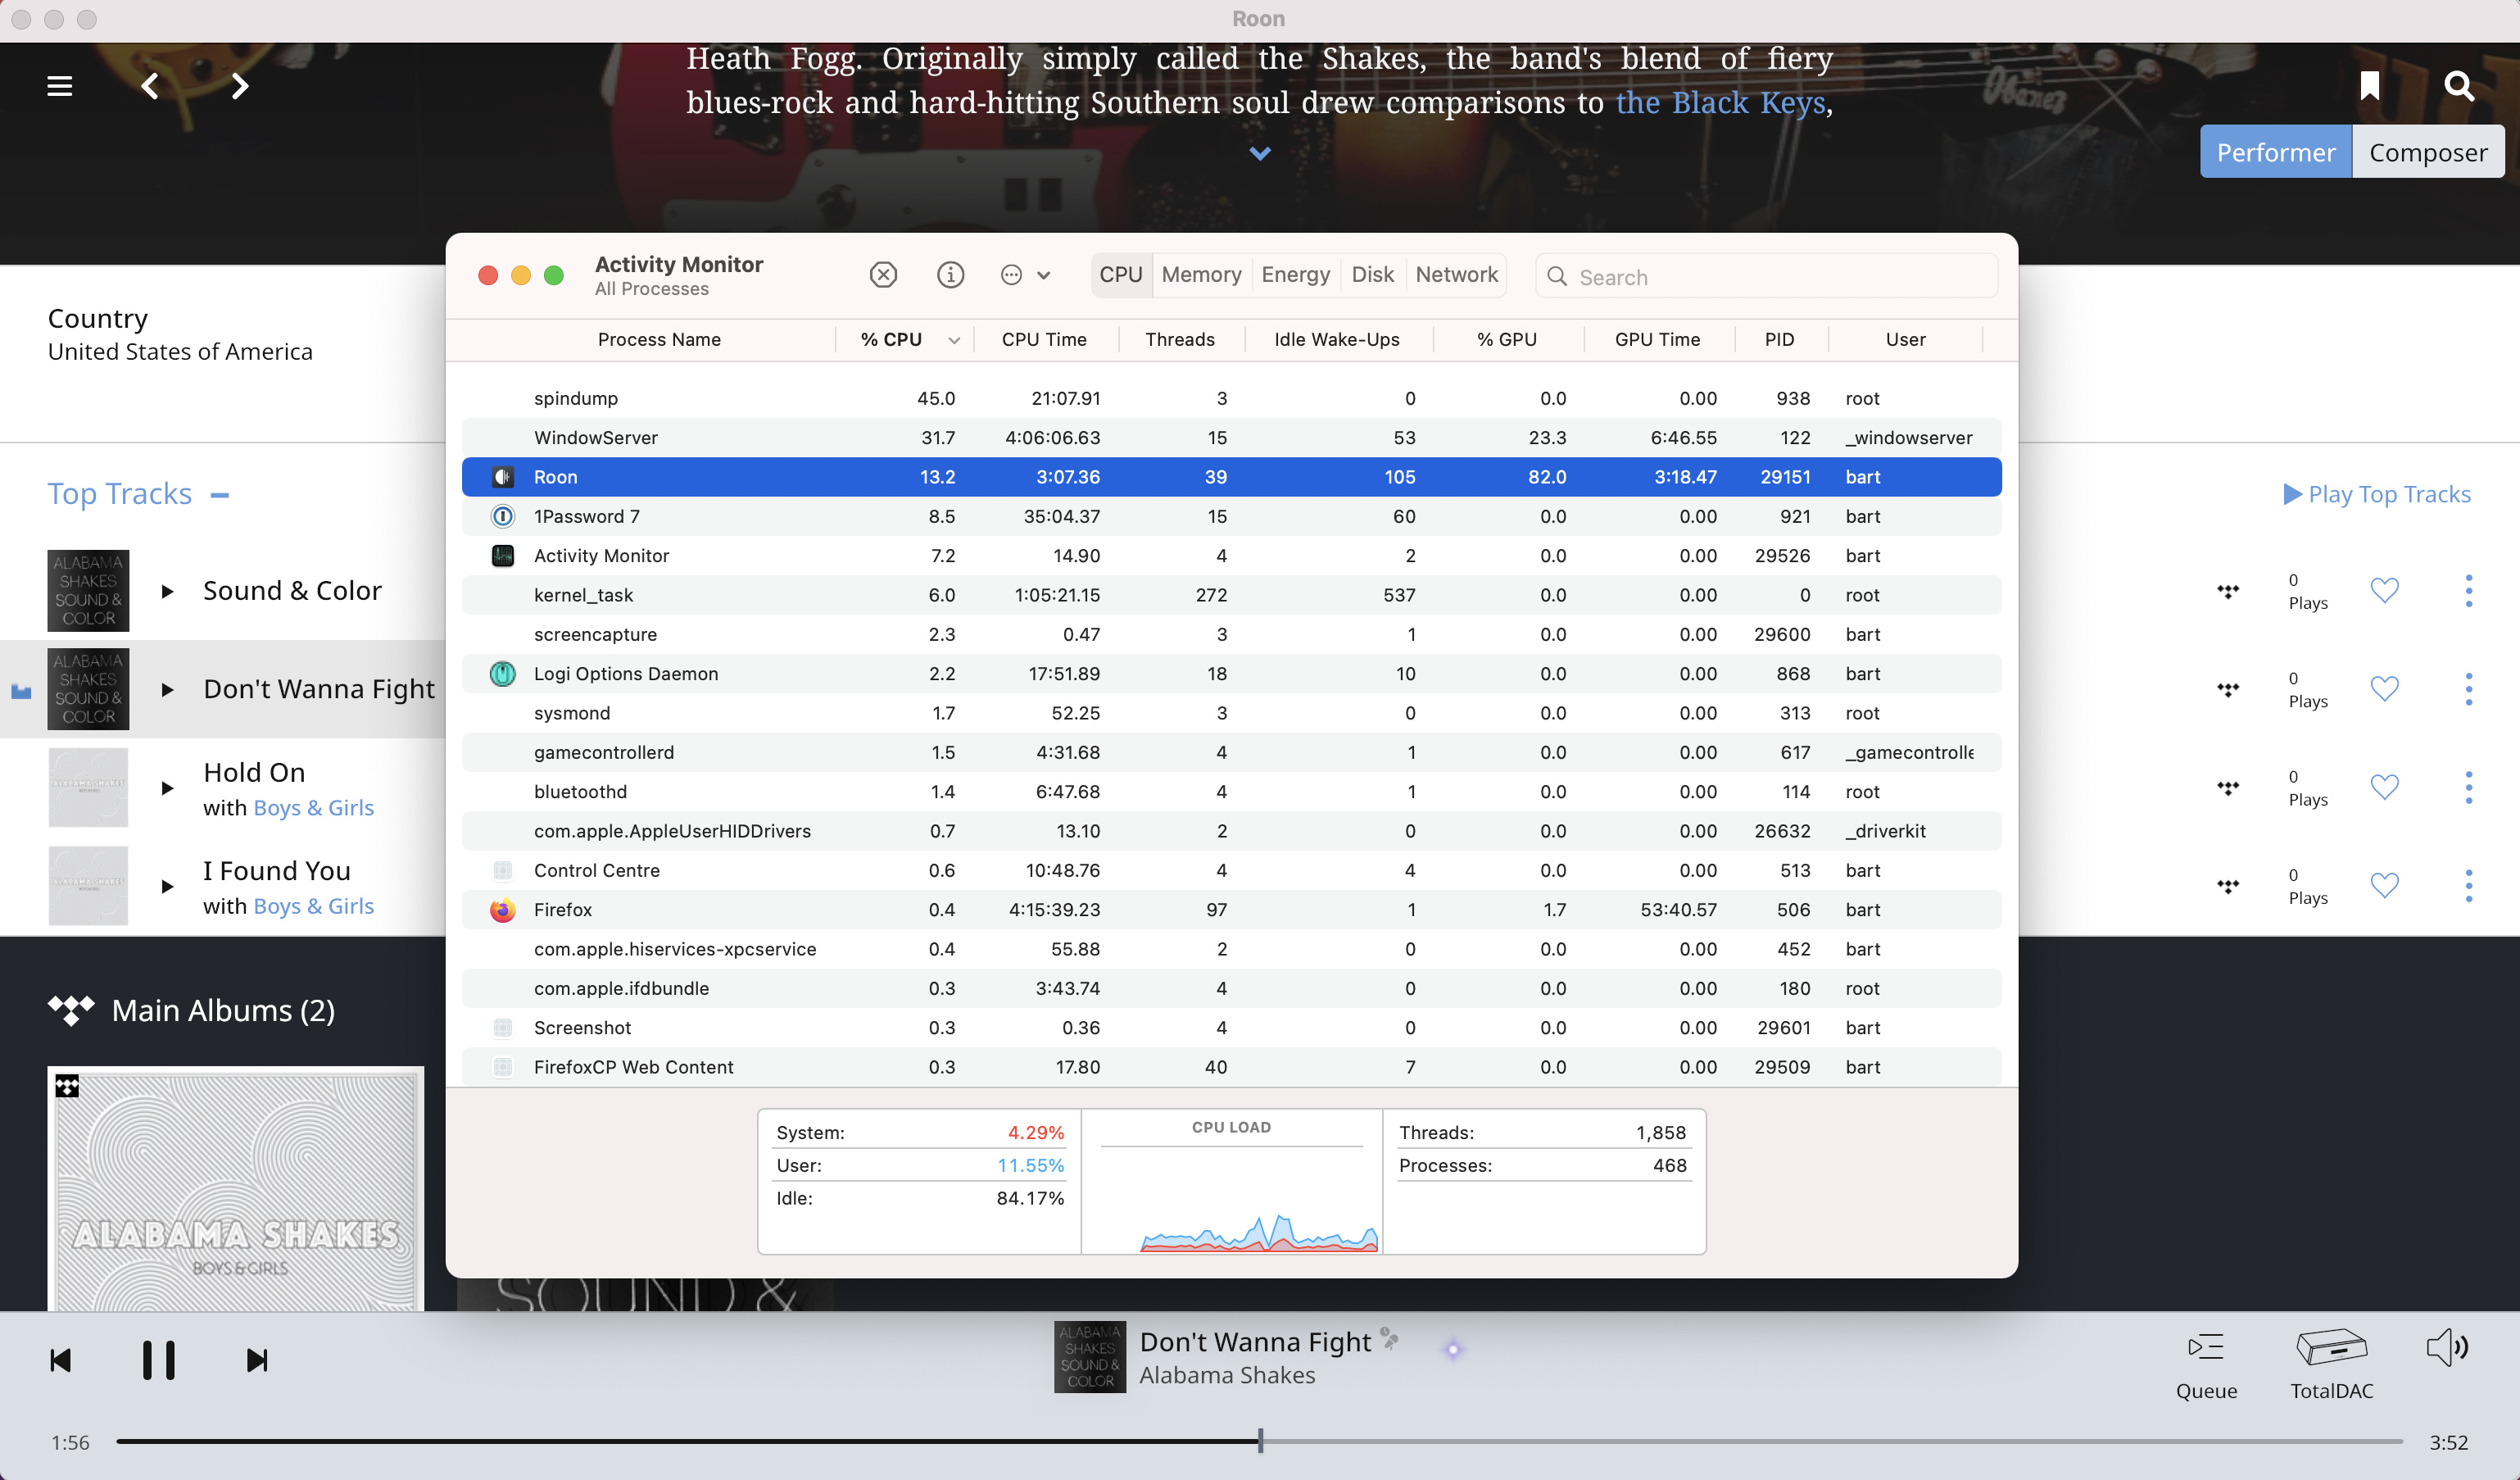
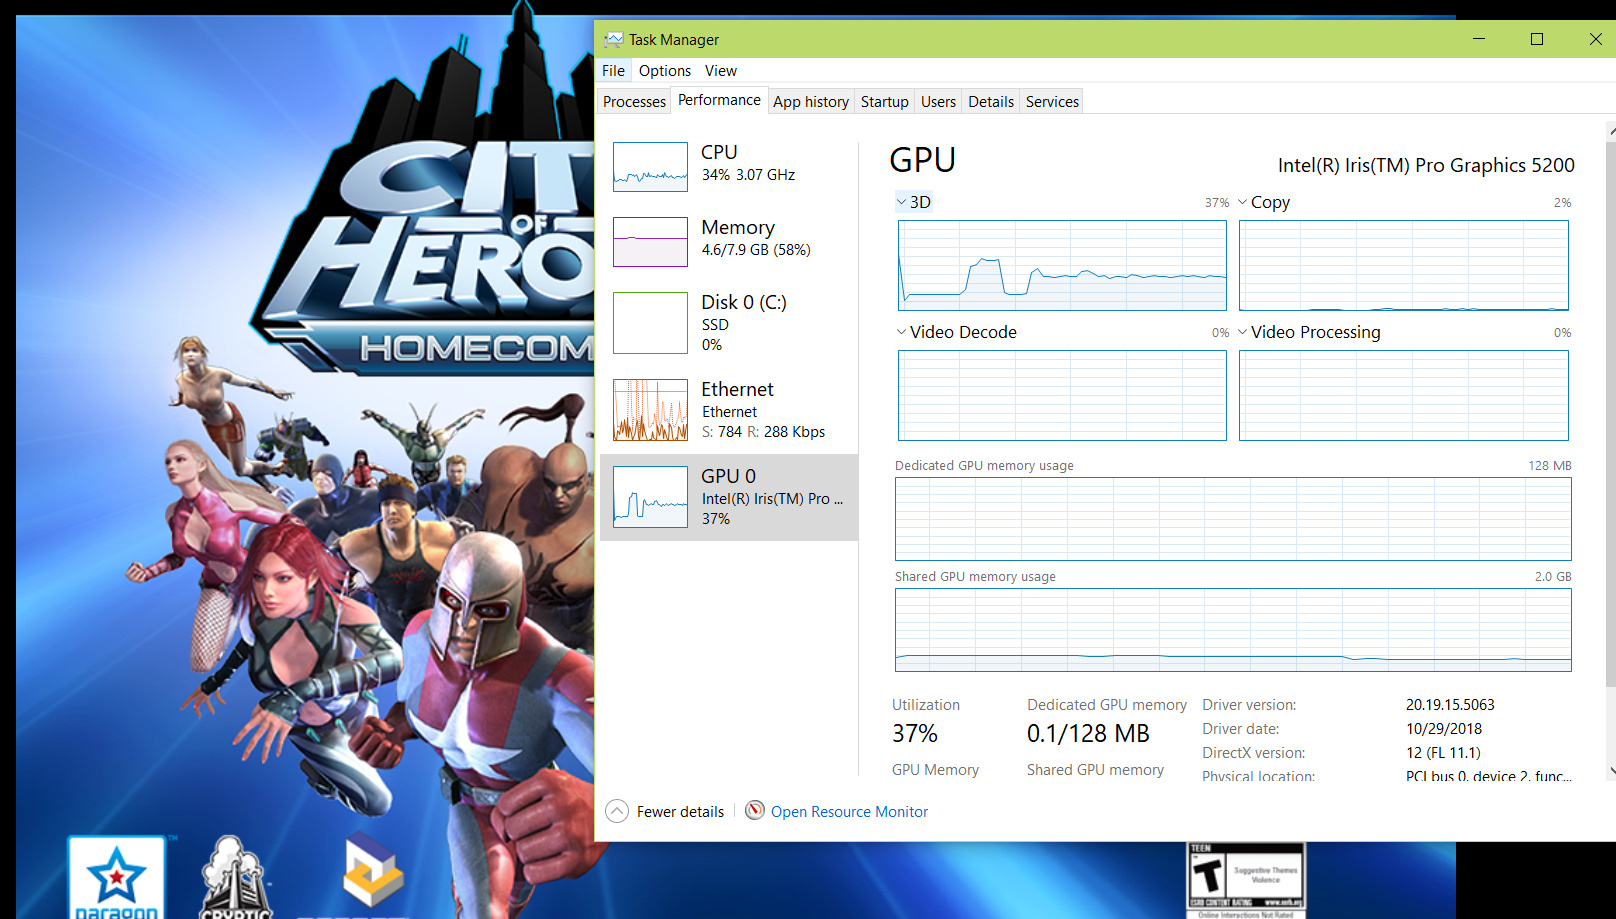
It is clear that some recently-made Macs are still exhibiting exceptionally high GPU utilization even with these optimizations in place. This suggests that there’s still something happening on affected hardware that we have yet to diagnose.

Our team continues to tease apart other aspects of this issue, including networking stack involvement, meaningful commonalities shared among affected hardware/OS combinations and usage patterns, as well as the sequence of events that leads to the problems in the first place.

As of yet, we have not been able to make these problems happen on demand, and the issues are not affecting people inside of Roon Labs reliably, even people with the same hardware and OS configuration as affected users; this has significantly slowed our progress, since we are not able to see it in front of us and debug the problem directly. Any information that might help us make this reproducible on demand would be a big help.

3 Likes

Nice explanation @dylan thanks for taking the time.
As always if you wanted to have access to my resources I would collaborate that way.
Thanks for keeping researching on these issues, hope Big Sur will not affect these improvements.
Thanks.

Thanks @dylan for the report and everyone in the team that has contributed to the investigation and mitigation until now. Like @mavmcl, I’m more than happy to assist you guys w/ any input/resources I can provide to make this progress further.

Many thanks to the Roon Team for this upgrade that includes fix(es) for the CPU/GPU consumption issue on Mac OS (Catalina).

1 Like

@support

In my case, the high gpu usage (>50%) seems to be triggered by the blue bar play indicator next to a track. Here’s an example scenario:

'm doing a search on a track or artist (e.g. Alabama Shakes), while another totally unrelated artist/track is playing (e.g. Nirvana). At this point, the gpu usage is neglible (~ 5%):

I queue up a track (e.g. Don’t wanna fight) of the Artist I searched for (ie. Alabama Shakes). As soon as that track gets played and the blue bars appear next to that track, the high gpu usage is triggered:

I can reproduce this behaviour at any time in any window that shows that blue bar next to the playing track. e.g. the album detail page to which the track belongs

Hi Nepherte,

FYI: the Blue Bars causing a GPU usage spike isn’t new and isn’t limited to macOS. There have been posts about this before.

Here is an HTPC NUC playing Roon client:

Win 10 NUC with Iris Pro graphics 5200. Not playing anything, Notice gpu is ~5%

I start something playing with only the bottom track bar playing animation at the bottom of the page. It increases it to ~ 12% usage:

Still not, bad, however, the moment I switch the page to the track list and get the track level blue play bars, I get an increase to ~45% usage as shown here, page switch time shown by Red arrow.:

I assume the GPU usage bump is due to the animations using the OPENGL drivers. I don’t know whether the whole page is being redrawn just for those blue bars, or, if that leap is just a processing overhead that activating the animation requires. Opening a graphics oriented video game causes similar GPU increases even if sitting at an entry screen (see below).

I do find it interesting that the welcome page of the full screen video game is taking less graphics power than the small blue bar animations.

1 Like

Big Sur interesting… the only thing I have with Big Sur is a MBA which has never had the GPU or CPU issue.

What’s the exact model and year? Issue only seems to present itself with fairly new laptop.

My MBP 13” 2020 has the issue. My MBP 13” 2016 does not. Not even with those blue bars next to the tracks.

However they are animating those blue bars, it seems to trigger something on the 2020. The performance is not supposed to be 5x worse on a 4 year more modern laptop :wink:

That MBA is an old early 2014 running Big Sur.

That definitely fits the pattern. Gpu issues only with newer models (roughly those with T2 chips)