I havnt seen any evidence of a leak, however ill keep an eye on it now it has been brought up.
1 Like
A question for those of you who are suspicious of a memory leak - are you making a lot of use of favourites with possibly big playlists?
Update:
I have tried running a memory profiler, however it seems that the profiler library I tried seems to cause more trouble than it helps resolve due to it using massive amounts of memory and not releasing it for some time, so that need some fixing/taming to be useful.
In order to keep an eye on this, once I have tamed the memory profiler, then I will probably include a means of memory use logging and heap snapshotting in the next update as both will be useful diagnostic aids in future.
@AdZero where in the NAS UI did you see 900MB? Also are you running the latest version of the extension (V2.1.4+254)? 900MB seems about right for a V1 docker image.
@Stampie - 99MB is a little more than I might have expected, but not if multiple hubs, lots of zones etc. (BTW - this size is about right for a V2 docker image size rather than process memory use)
For reference, this is the extension process running in docker on my QNAP NAS (Apps / resource monitor / processes - the full process name will probably be truncated as below):
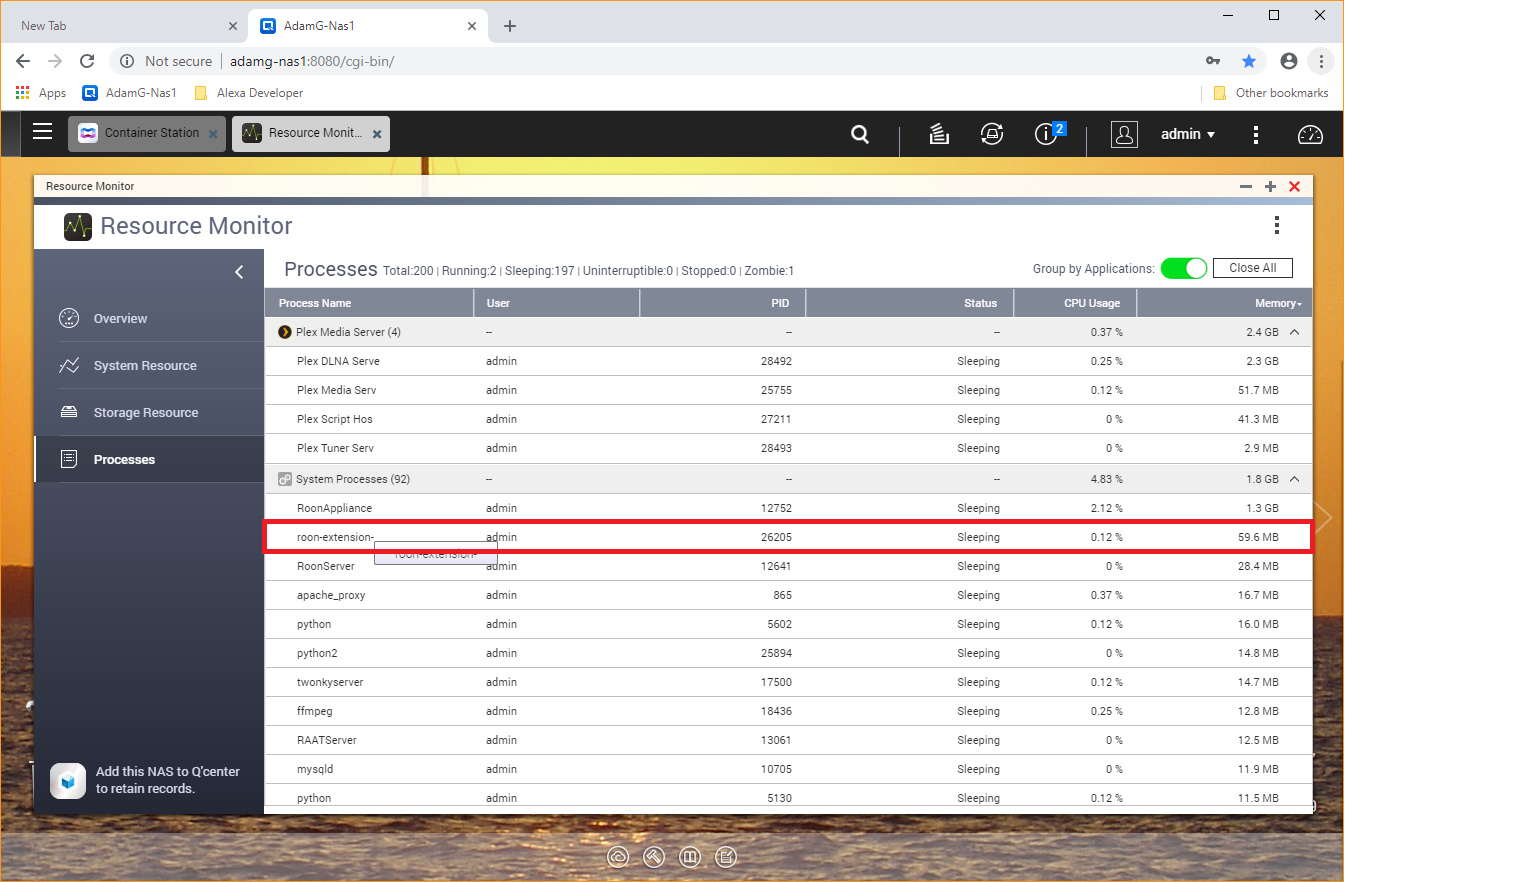
I would expect the memory use to jump around a bit (tends to slow rise, then quickly fall) because of the way garbage collection works when unconstrained. I generally see around 63MB-75MB on here. It is quite reasonable for some users with multiple hubs and many zones to see higher figures, but not vastly higher. I do know of some operations that can cause temporary jumps in memory use (up to another 60MB, but they do not occur in normal use).
The V1 extension was both a disc and memory hog in docker which was part of why I switched over to compiling it. It was basically a prototype to gage interest while I figured out the tech.
@Adam_Goodfellow
Wow, just checked again, and it has gone up to 428mb!. I only have a single hub and zone, so not a complicated set-up
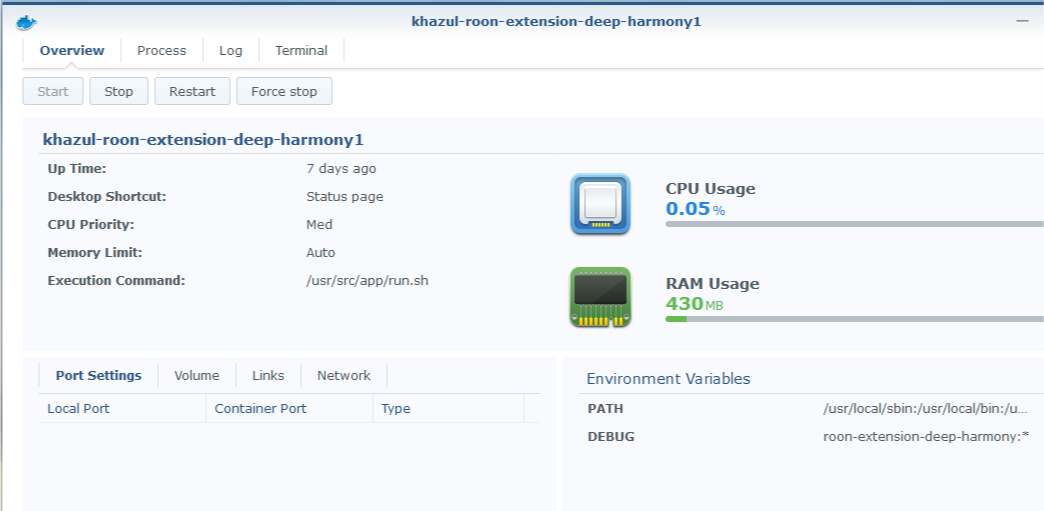
I restarted it and the memory usage has gone down to 31mb
Let me know if you want any logs / testing done to help locate the root cause
Thanks - it is best to wait till I make an update that is capable of memory snapshots and memory usage logging - the logs are unlikely to tell me anything useful about memory usage.
It may be worth also limiting memory use by the container to 150MB for now.
Hi.
Here’s the answers to your two questions :
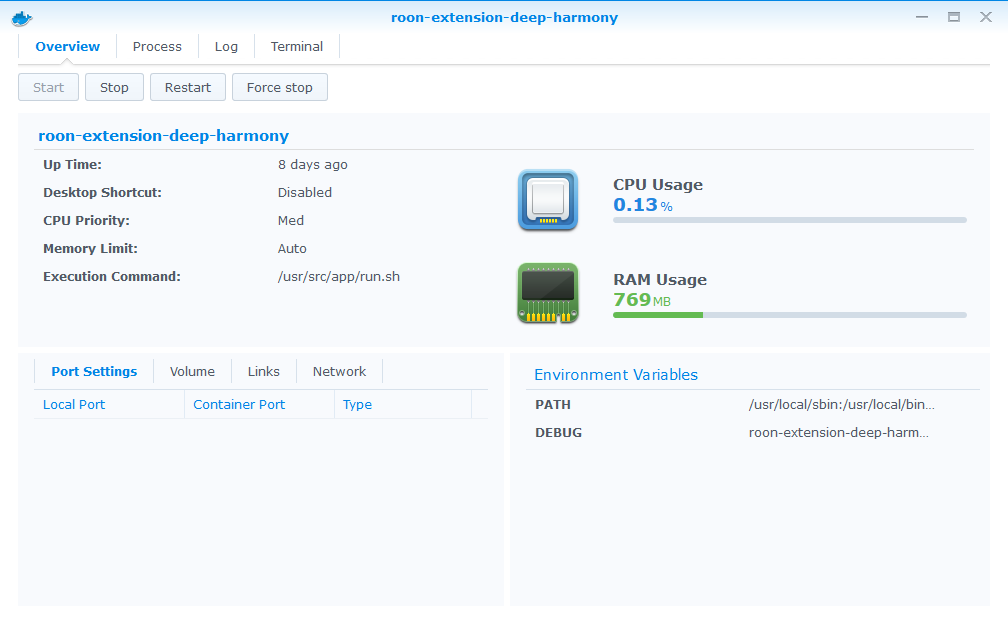
- Memory usage in the appropriate container window on Synology Docker UI, as in shown in last @Stampie post.
- I’m using a v2 image (tag latest) which has been updated several times. I’m currently on the last version (V2.1.4+254)
Memory consumption is currently stable at 90 MB since last container restart two days ago. I guess something must trigger this memory consumption.
It only appears after a long period and has been noticed twice since moving to V2.
Hi.
As an addition to the previous posts, here’s another proof of high memory consumption.
Not my best score but almost 
Thanks for update. I havn’t forgotten this. I am still looking for a decent way to get some useful diagnostics on this included in the extension that doesn’t cause more harm than it solves.
Meanwhile unfortunately I am not seeing this here.
Mines not using any more than I assign it in container station.
Hi @Adam_Goodfellow the plugin is definitely eating ram. I just got a message from my Nas saying your extension has used all my ram and it’s shut it down.  Taken a few weeks but it does it.
OK Thanks.
Unhelpfully mine has been steady at around 63Mb gave or take a few MB over the last few weeks.
Do you want a log?
Sure always worth a look in case anything odd going on.
Thanks
Pm’d logs.
2.1.5 Released
Changes
- Added heap usage debugging to logs.
- Some very minor speculative fixes.
Thanks. There was nothing in them to help see what may cause memory to be consumed. I have updated the release to at least report on memory usage to see if that shows anything.
If it doesn’t then maybe the short term answer will be to force an overnight restart if memory use exceeds some threshold.
Ok, thanks for looking. I’ll update and send through ifnit happens again.
Thank You very much for this really helpful and nice app.
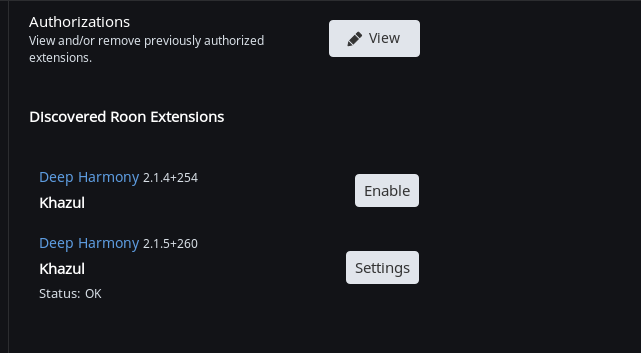
Please have a look on the screenshot. What’s going wrong here? It is possible that I installed it twice? How could I delete the second installation? I run Ubuntu Server on a Intel NUC i5.
Is this installed in docker or directly on ubuntu with a start script?
If docker, then I guess the obvious is making sure there is only one docker container running for it. ‘’‘docker container ls’’’ should list them.
There are two docker containers listed “friendly_leavitt” (created 2 days ago) and “friendly_snyder” (created 7 days ago). I guess one of this containers (snyder?) could be deleted. How could I do that? Thanks.
Edit: Problem solved. Second docker container identified, stopped and deleted. Thanks for help.