Slowly getting closer and closer to stable system…
Changed my Asus router to a Netgear and the Roon remote on my iPad is stable now, thanks to all of you who helped me out!
If I understand it right when the wheel in Roon is spinning Roon is working, correct?
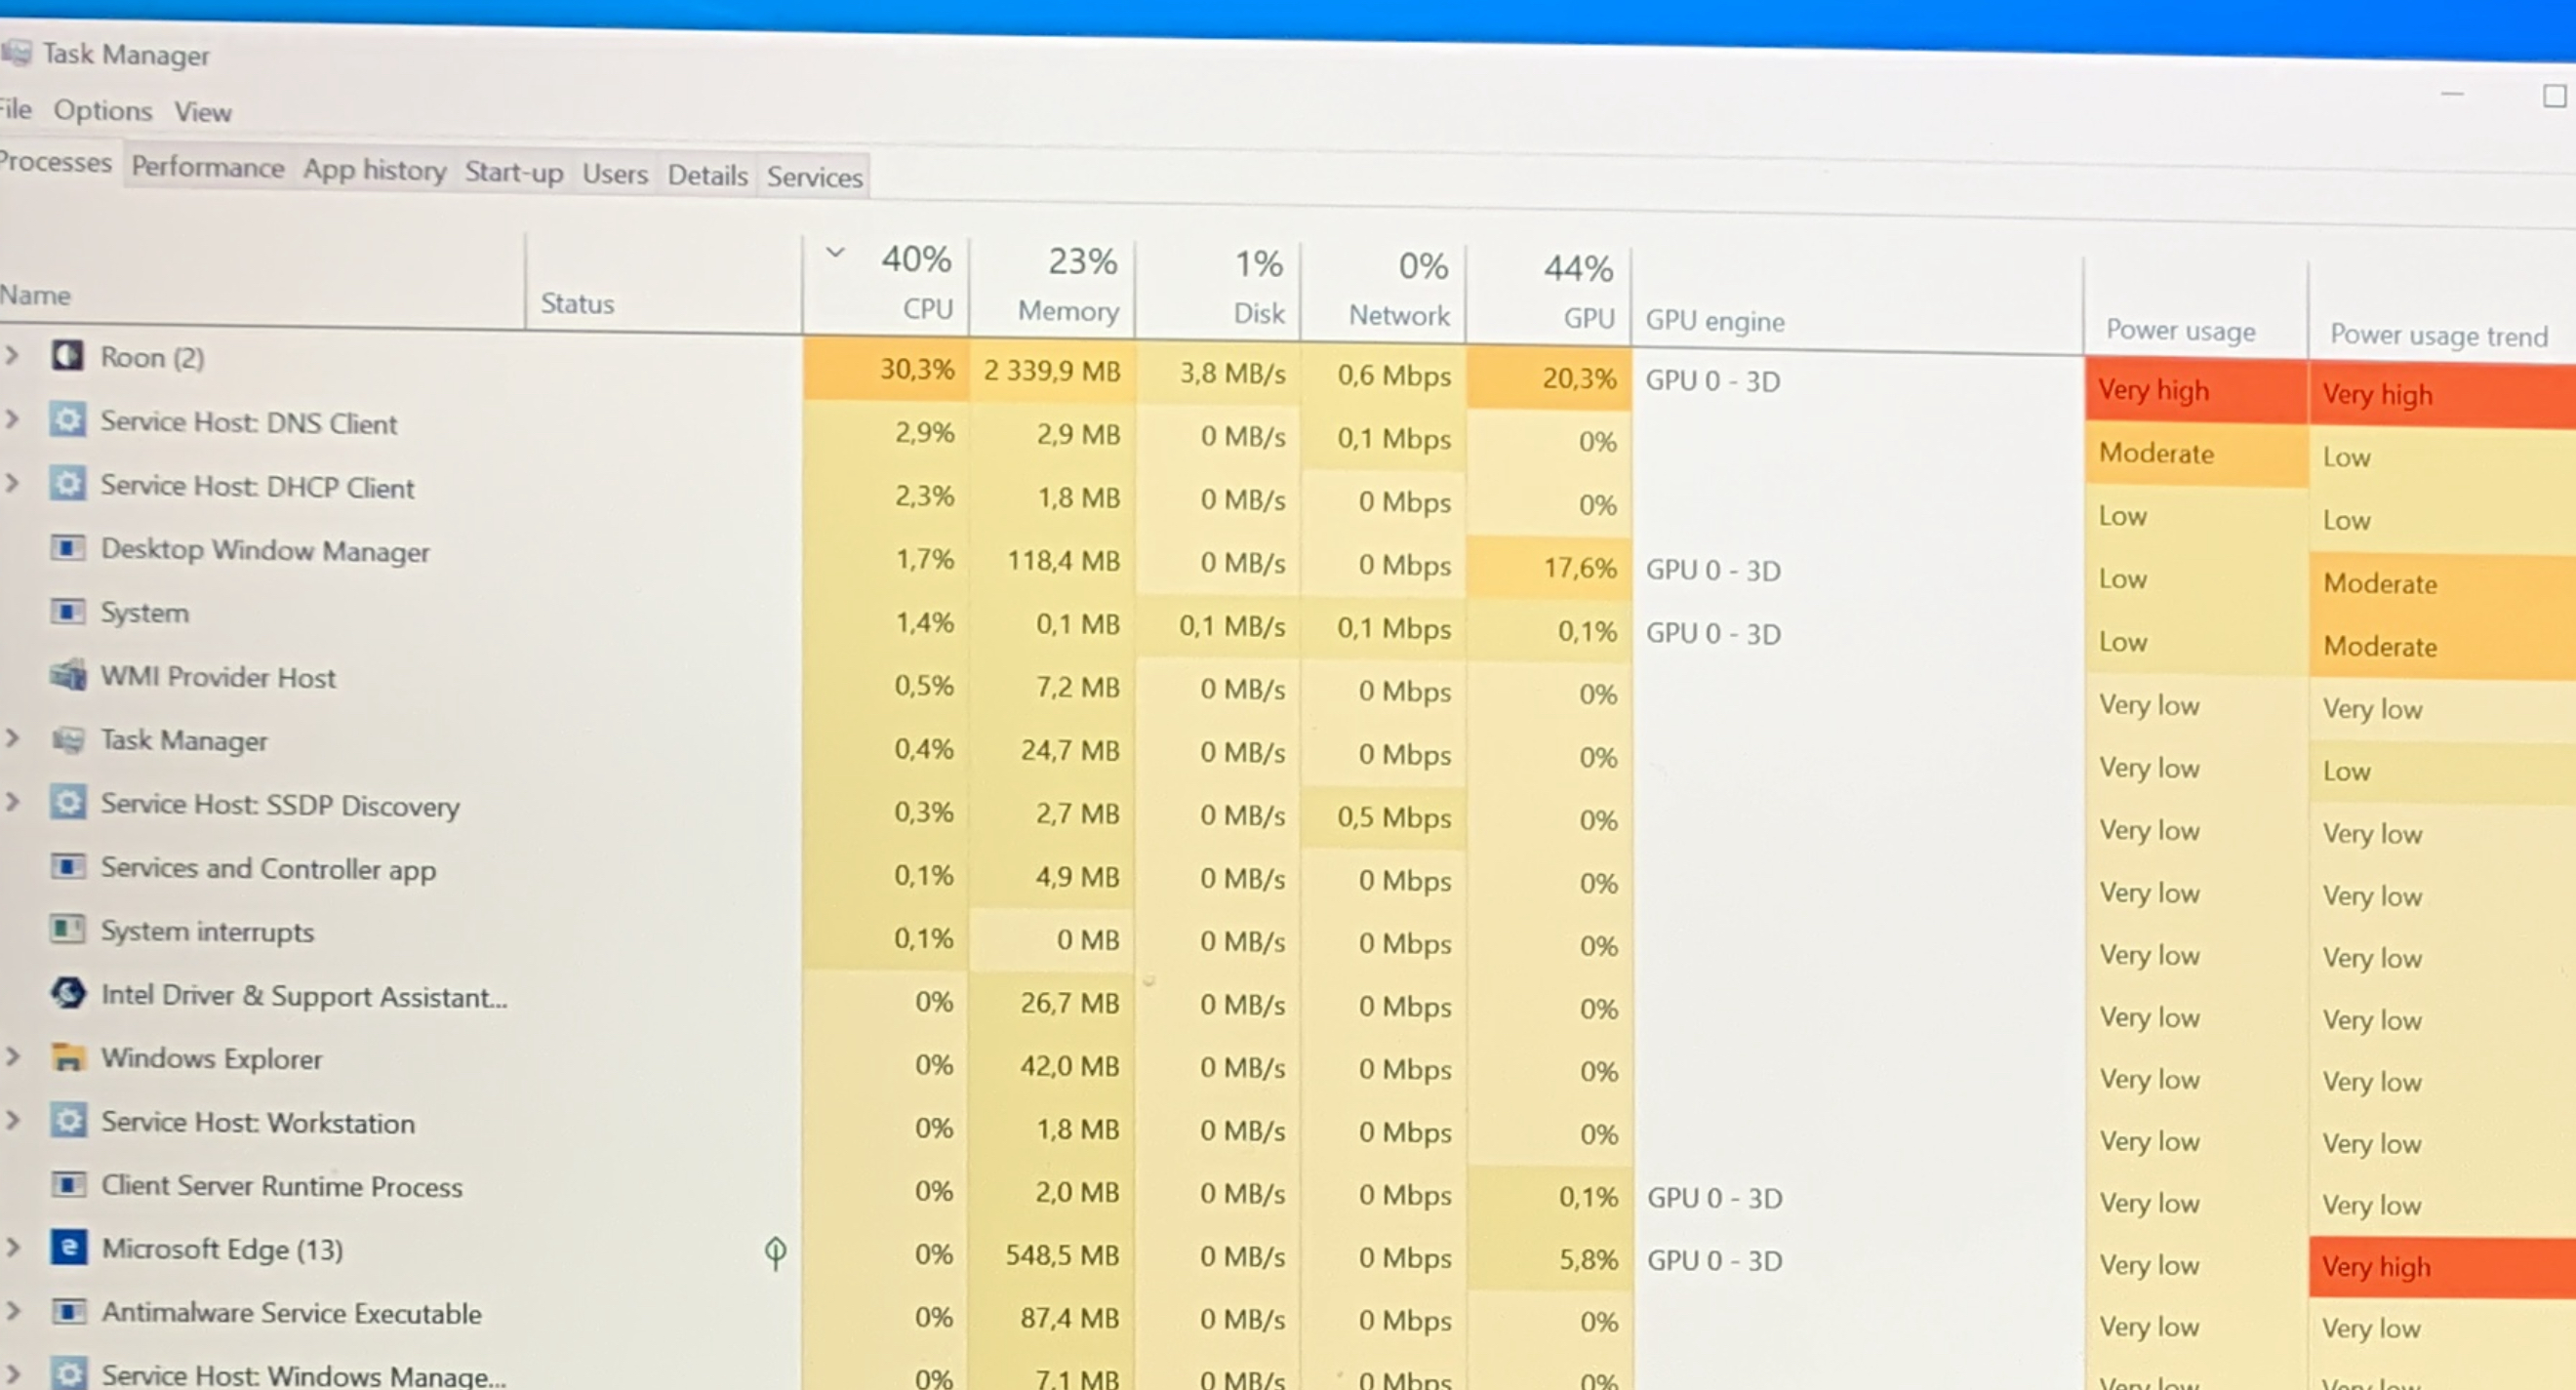
The attached picture shows the activity level on my NUC10i7 and Roon remote, is anything wrong with my system looking at the computer resources used?
This usually means that Roon is analysing your local music files, either adding files to the library or doing audio analysis; see this kb article. The latter can be very processor intensive, so best practice is to let it run its course before attempting some serious listening. Or, as the article says, give Roon permission to use all the resources it can to get through the task first before starting to use the library.
As you might be able to see on the photo the wheel is not spinning.
Does it mean that Roon has done all the analysis?
Sorry, are you referring to the circular arrow icon on the top left of the screen? This one:

That’s not the “spinning wheel icon” that indicates that Roon is working on the Library. That’s the “Refresh” icon - used to refresh the currently displayed page. It’s useful, for example on the “Discover” page, where using it will generate a new page of suggestions from Roon for discovering music in your Library.
The “spinning wheel icon” lives on the opposite side of the screen, next to the Bookmark and Search icons. It only appears if Roon is working on the Library.

Just to be clear, is your screenshot showing the Task Manager activity of the PC where the Roon Core is running, or just the activity of running the Roon client window? If it’s the latter, then 30% CPU usage is high for simply running the Roon client (the user interface and control component of Roon). On my Windows systems running the Roon client, the figure is rarely more than a few %.
If it’s where the Roon Core is running, then this figure may be OK - but I haven’t run a Core on Windows for years now, so I couldn’t say for sure. Perhaps someone else could answer this…