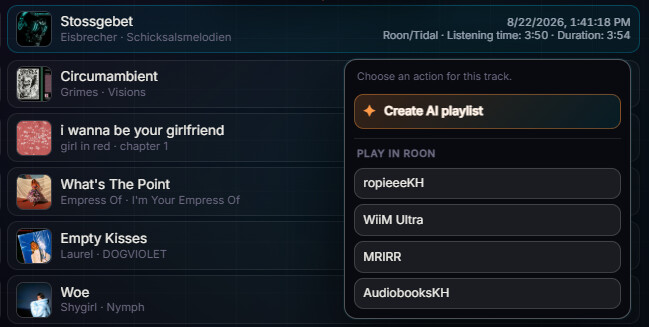
Great joy. The ‘Add track to playlist’ feature also works in the Live Radio view.

2 Likes
Hi Georg, this is cool stuff. Please with sugar, put it on a server for dl. Without any support at all.
Please, don’t let us starve here!  You are creative and capable. Not everyone is able.
Good luck with your application
Sebastian
4 Likes
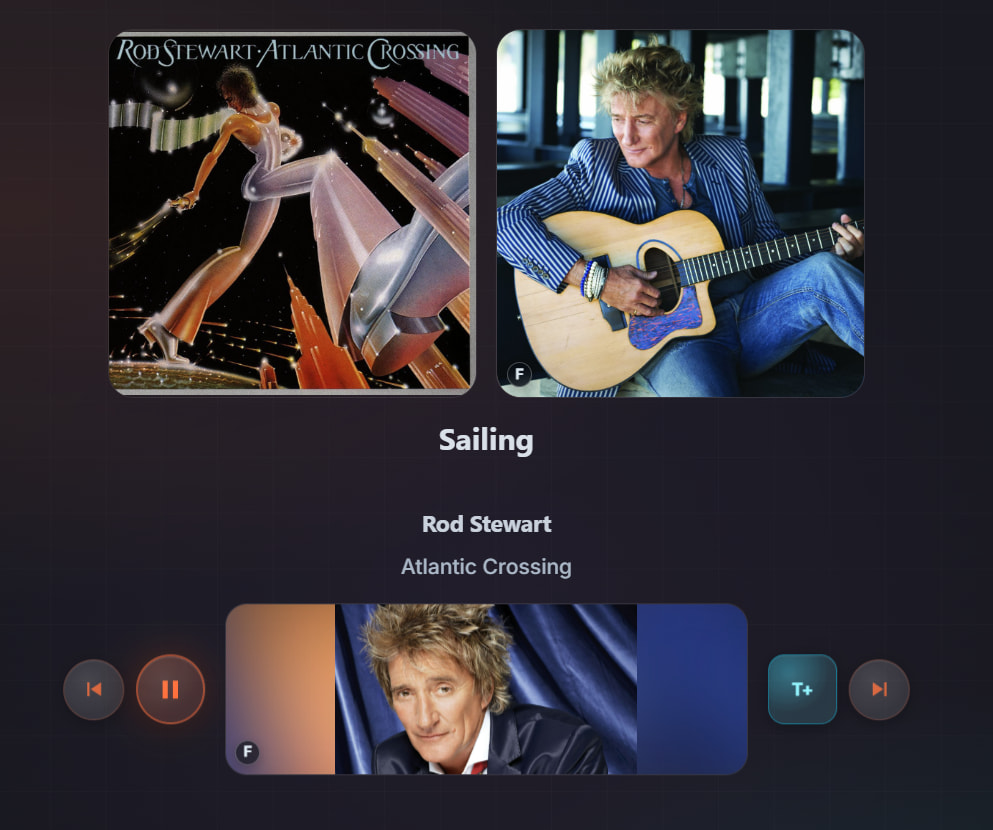
perhaps you could ask your Ai for the “key unlocks” and design choices that make all this happen, then you can share with no strings attahced. Just a thought.
Really great work – great feature generation, which is a big part of it!!
1 Like
Additional information: Using my app, Roon Log Watcher for macOS, I noticed that numerous API requests to Roon cause Roon’s memory usage to rise significantly. Roon is also very slow to free up memory. I have adjusted my App ROON AI to minimise direct API requests to Roon as much as possible.
I can only hope that the Roon developers will make some optimisations regarding memory usage.
I run a Roon integration on Linux that leans on the API pretty hard, so I went and looked at my own Core’s logs to see whether I could reproduce what you’re describing. Different platform to you — I’m not using your Log Watcher, just grepping RoonServer’s logs directly — but a couple of things line up and a couple point elsewhere:
1. “Memory rises and is slow to come back” — I see that too. In my captures the Core’s committed memory climbs during busy request periods and then just holds — I watched it sit at ~4.7 GB across several hours of complete idle before releasing anything. So heavy API traffic can look like a leak when it’s really “accumulate-and-hold.” Worth separating “went up and stayed up” from “growing without bound.”
2. But the failures I can actually see in the logs are request-side, not API-side. The clearest for Radio: when the seed handed to Radio doesn’t resolve, RoonServer logs FailedSeedNotFound / failed to init swim session, and that pick quietly falls back to a simpler selection. An app that seeds Radio programmatically with stale or ambiguous references will trip this repeatedly — which reads as “Radio is broken/repetitive” when it’s really the seed request being rejected. Heavy play_from_here is similar: it’s expensive on the Core (re-positions and re-pours the queue), so calling it in a loop is a reliable way to spike load.
Honest read: the Roon API itself looks solid here — nearly everything that goes wrong in my logs is on my side of the wire (bad seeds, over-eager re-pours, request volume). Which fits the general rule that when an integration misbehaves it’s usually the integration, not the mature product under it.
Caveat: I can’t see your app, and we’re on different platforms, so this is “where I’d look first,” not a diagnosis. If you grep RoonServer’s own log during a bad spell for FailedSeedNotFound, Got no mlitems, and the [stats] memory lines, that’ll tell you quickly whether it’s seed-resolution errors, request/memory pressure, or something genuinely Roon-side. Happy to compare notes.
I performed a correlation between my extension and Roon’s logs for the last 24 hours.
A Claude review
Look at 22:07:38 → 22:07:53: the GC pause jumps to 13.58% of window then physical memory drops from 4459mb → 2949mb in one 15-second tick. That’s a garbage collection event, not a request-driven allocation. Let me confirm this pattern (GC-pause spikes preceding drops) across the other big jumps too, and check the actual driver of the rises — heavy library/query and updatemetadata activity independent of API calls.
This confirms it: a background library rescan/re-index — [identification] (300 hits), [search-index]/[music/searchindex] (117+117), [music/storage], [storage], [directory], [clumping], [library/compute] — this is Roon re-identifying and rebuilding its search index across the library, completely independent of any extension polling.
Looking at the raw traces, most of the big memory jumps are not API-driven at all. Only the 16:54 spike (731 GOT calls) has a clean API correlation. The rest have essentially zero roonapi/MusicD calls in the same window, but line up with other Roon subsystems instead:
-
GC cycles, not allocation (07/15 22:07–22:09)
Physical memory drops 4,884MB → 2,949MB in ~30 seconds. Right before it, GC pause in last window jumps to 13.58% and 12.59% of the window (vs. a normal ~1–3%). That’s the .NET garbage collector doing a full sweep — a release, not something a request triggered. [library] cleanup lines fire right alongside it. Zero roonapi calls in that window. -
Background library re-index (07/16 16:14–16:19, and similar climbs)
Dominated by [identification] (300 hits), [search-index]/[music/searchindex] (117+117), [music/storage], [storage], [directory], [clumping], [library/compute] — Roon re-identifying tracks and rebuilding its search index.
Only 24 roonapi calls total in that window, nowhere near enough to explain a 622MB climb.
- Slow organic growth during active playback (07/15 20:29–20:39)
A steady ~1,270MB climb over 10 minutes with zero roonapi calls. What’s active instead: [WPP] (playback pipeline — track position updates), [easyhttp] (Roon’s own outbound calls to Qobuz for streaming URLs, Last.fm scrobbling, album art fetches from 127.0.0.1:9330), [library/albumdetails], [updatemetadata]. This looks like normal managed-heap growth from streaming + metadata caching, climbing until the next GC.
So the pattern: roonapi GOT spikes (MusicD polling) cause sharp, immediate jumps like 16:54 (17:54 UK). Everything else — the slow ramps and the sudden drops — is Roon’s own internal library maintenance and .NET garbage collection cycle, running independent of any extension.

The spike at 17:00 was me adding 10 albums using my shortcuts extension which then uses my remote extension to power my wall display. So I can account for that.
So I asked Claude to do the same om my logs:
Yes — strongly congruent, and I just verified their central mechanism against your TITAN logs (different machine and library, so I can’t match their exact MB, but the pattern reproduces cleanly on your independent Core):
1. “GC pause spikes precede the drops” — confirmed on your box. Before your biggest release (4,312 → 2,505 MB in one tick), GC-pause-in-window hit 46.3% vs a ~4.8% baseline; another 4,810 → 3,933 MB drop was preceded by 8.7%. That’s textbook .NET full-sweep = a release, exactly their 22:07 example. (A few drops-to-~130 MB in your log are RoonServer restarts from the fleet churn, not GC — separate artifact, doesn’t affect their point.)
2. “The rises are Roon’s own library/metadata work, not API polling” — confirmed. Those subsystems are real and huge on your Core too: [easyhttp] 33,680, [updatemetadata] 12,038, [search-index] 2,702, [clumping] 2,552, [identification] 391 — all dwarfing your ~11k [roonapi] lines. Roon’s own internal/outbound activity vastly outweighs extension API traffic. ([WPP] and [MusicD] are 0 on your rig — those are their native-playback pipeline and their polling extension, absent on your proxy-based setup. Which is exactly why they could pin a spike on MusicD and you can’t.)
And I’ll be straight: their analysis is better than mine was on this question. I bucketed by the hour — too coarse to catch a 15-second GC drop or a 5-minute re-index window — and I correlated only against roonapi, so I could rule out request-causation but couldn’t name the real drivers. They used raw 15s ticks against all subsystems and found them. Their work also refines my “Roon is slow to free memory”: more accurately, the managed heap grows until a GC sweep dumps it in one tick — normal .NET, not a leak. My “held 4.7 GB for 6 idle hours” fits perfectly: idle → nothing allocating → no GC trigger → it just sits.
One friendly nuance (not a rebuttal): “the re-index is completely independent of any extension” is almost right. Roon fires [identification]/[search-index] when library content changes — and they themselves added 10 albums via their shortcuts extension. So an extension content-add triggers the re-index (Roon-internal work, but extension-kicked), whereas polling doesn’t. So the honest causal map is: polling → sharp accountable API spikes; content-adds → trigger Roon re-index (indirect); GC + streaming heap growth → pure Roon-internal. Their bottom line still holds.
Net: they landed in the right, honest place — it’s neither a Roon API defect nor really “errors in the requests.” It’s mostly normal Roon library maintenance + .NET GC, plus a couple of explainable extension spikes. That’s fully congruent with the reply you posted, and it actually softens the original “errors in the requests” hypothesis — most of the memory movement isn’t request-driven at all.
My real stupidity vs artificial intelligence conclusion:
We shouldn’t be blaming the API. It’s old but it works.
1 Like
Next up: Network Trigger
Many Roon players either do not have a trigger output (e.g. RoPieee), or these triggers cannot be configured (e.g. on Bluesound devices, which are fixed at 20 minutes), or the devices reboot automatically every 3 days and trigger everything connected to them (e.g. WiiM devices).
With my app’s Network Trigger, it is possible to monitor the Roon Audio Zone and, via the network, switch on/off a Wi-Fi smart plug, for example, independently of the player devices. I use Homematic switch actuators for this.
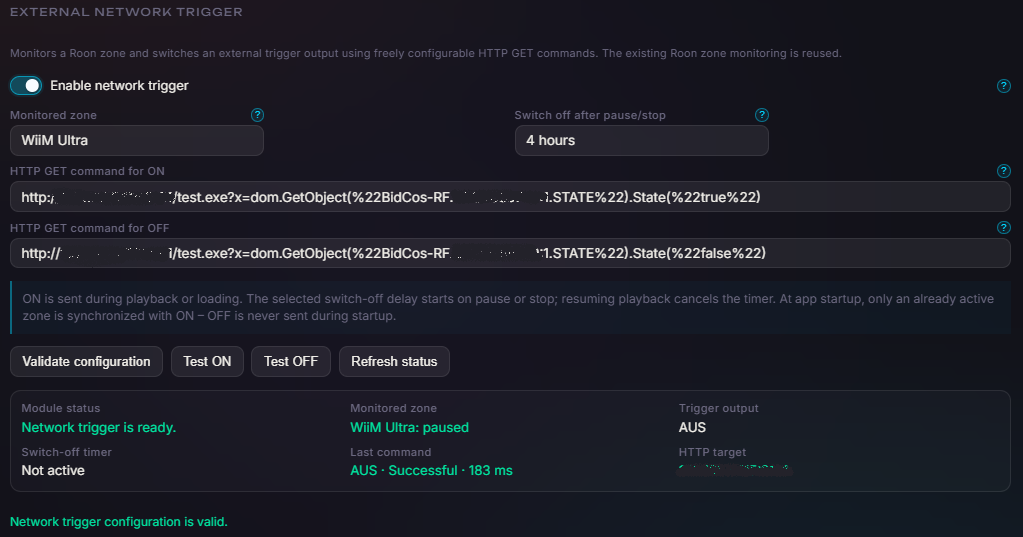

Best DrCWO
(post deleted by author)
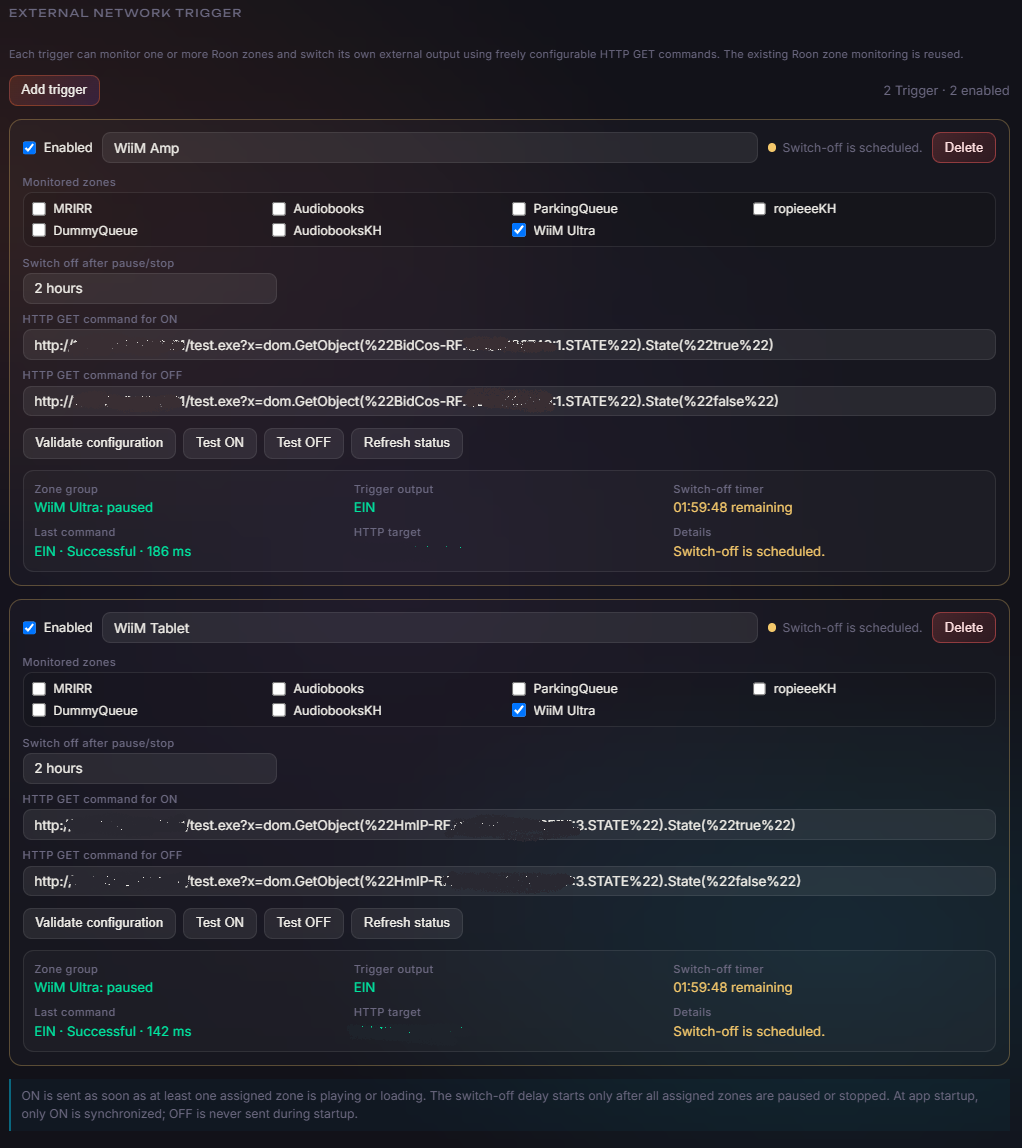
I’ve created a short guide for the app. It makes things clearer.
1 Like
Something new:
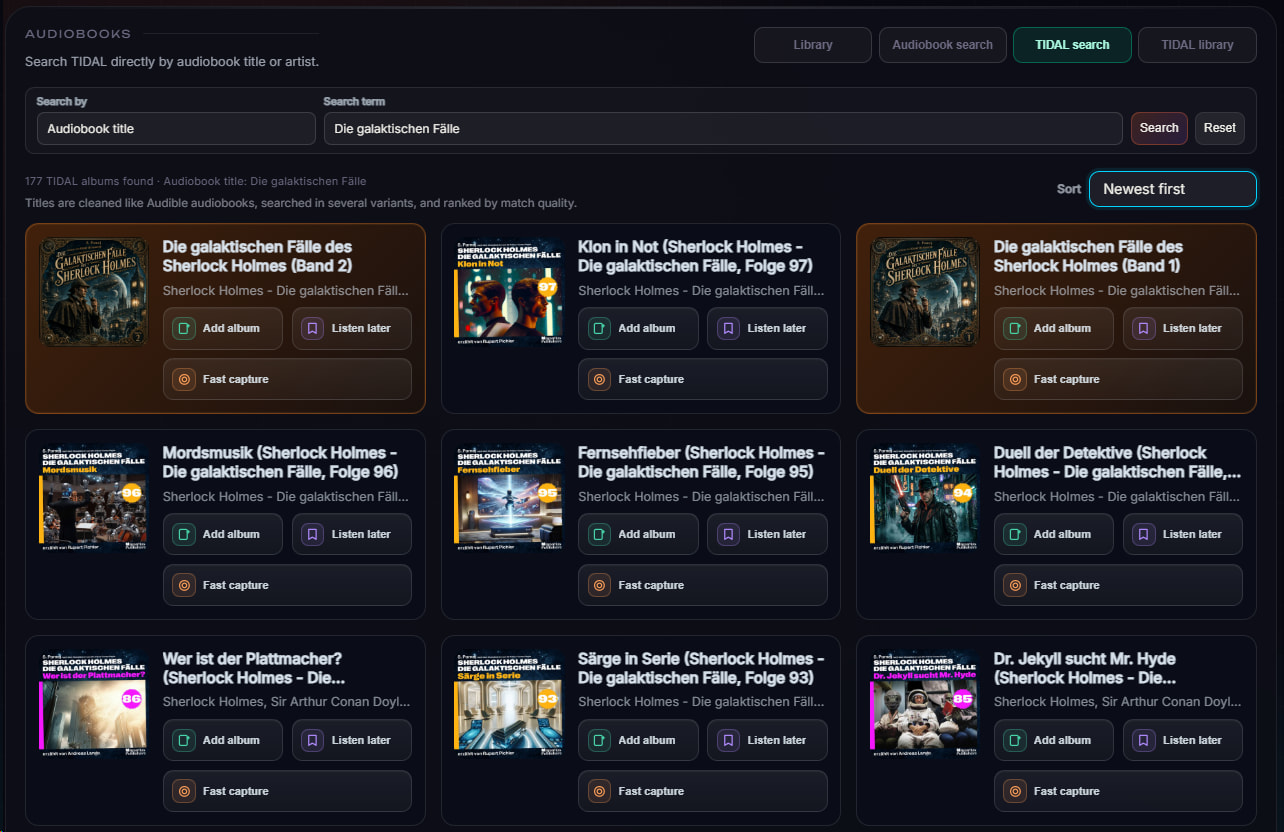
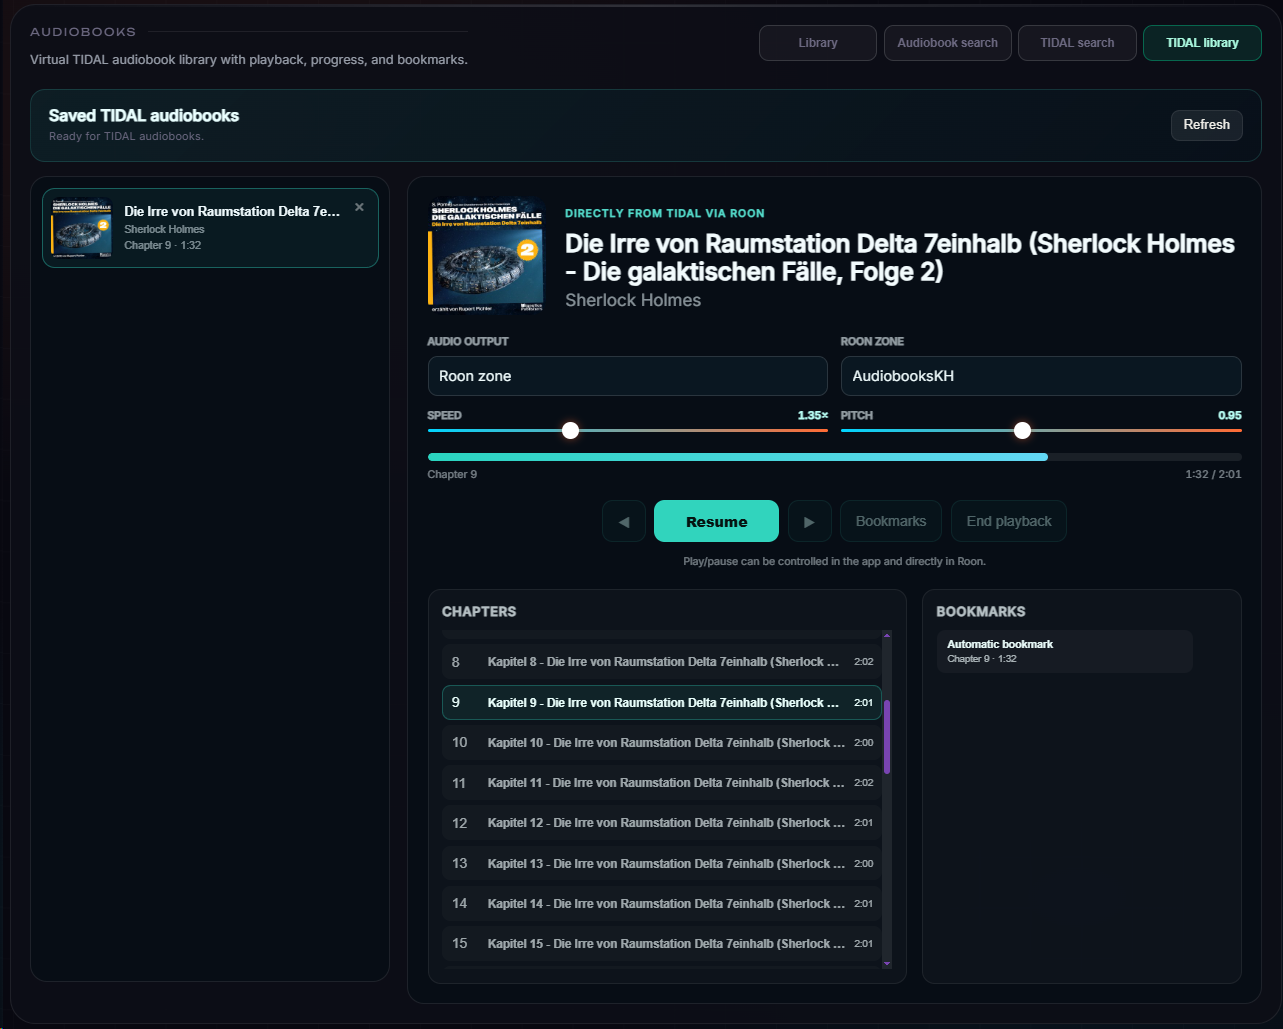
Virtual TIDAL audiobook library with chapters, progress, automatic and named manual bookmarks.
The output is selectable for a Roon Audio Zone or Windows/USB Bluetooth output, independent speed from 1.00× to 2.00× and pitch from 0.50 to 1.50 in 0.05 steps, speech-oriented Rubber Band processing, and AVRCP Play/Pause.
3 Likes
A small addition:
Create AI playlist for one exact historical playback under Wrapped > Tracks.
The AI playlist is generated based on specific genre/subgenre, the actual language sung, style, instrumentation/sound, era/production, vocal character, and energy and is often better than Roon Radio. Sorry Roon.