I can’t find any documentation about the included DSP filters. I know the difference between minimum and linear phase, but what about “precise” vs. “smooth”? I found an unanswered question from 2 years ago, but what about some specs or curves for all four? Some guidance would help. Thanks.

Also a smooth filter leads to some limitation of frequency response of about 20 kHz and above (for hi-res signals).
1 Like
I realise you are trying to be helpful but to most people these graphs mean nothing, you need to explain what they are showing and preferably in terms generally understood.
.sjb
Do you know what the filters’ frequency response and impulse response look like? Spurious noise, etc.? Some filters allow beautiful looking impulse responses but don’t filter out of band stuff well at all.
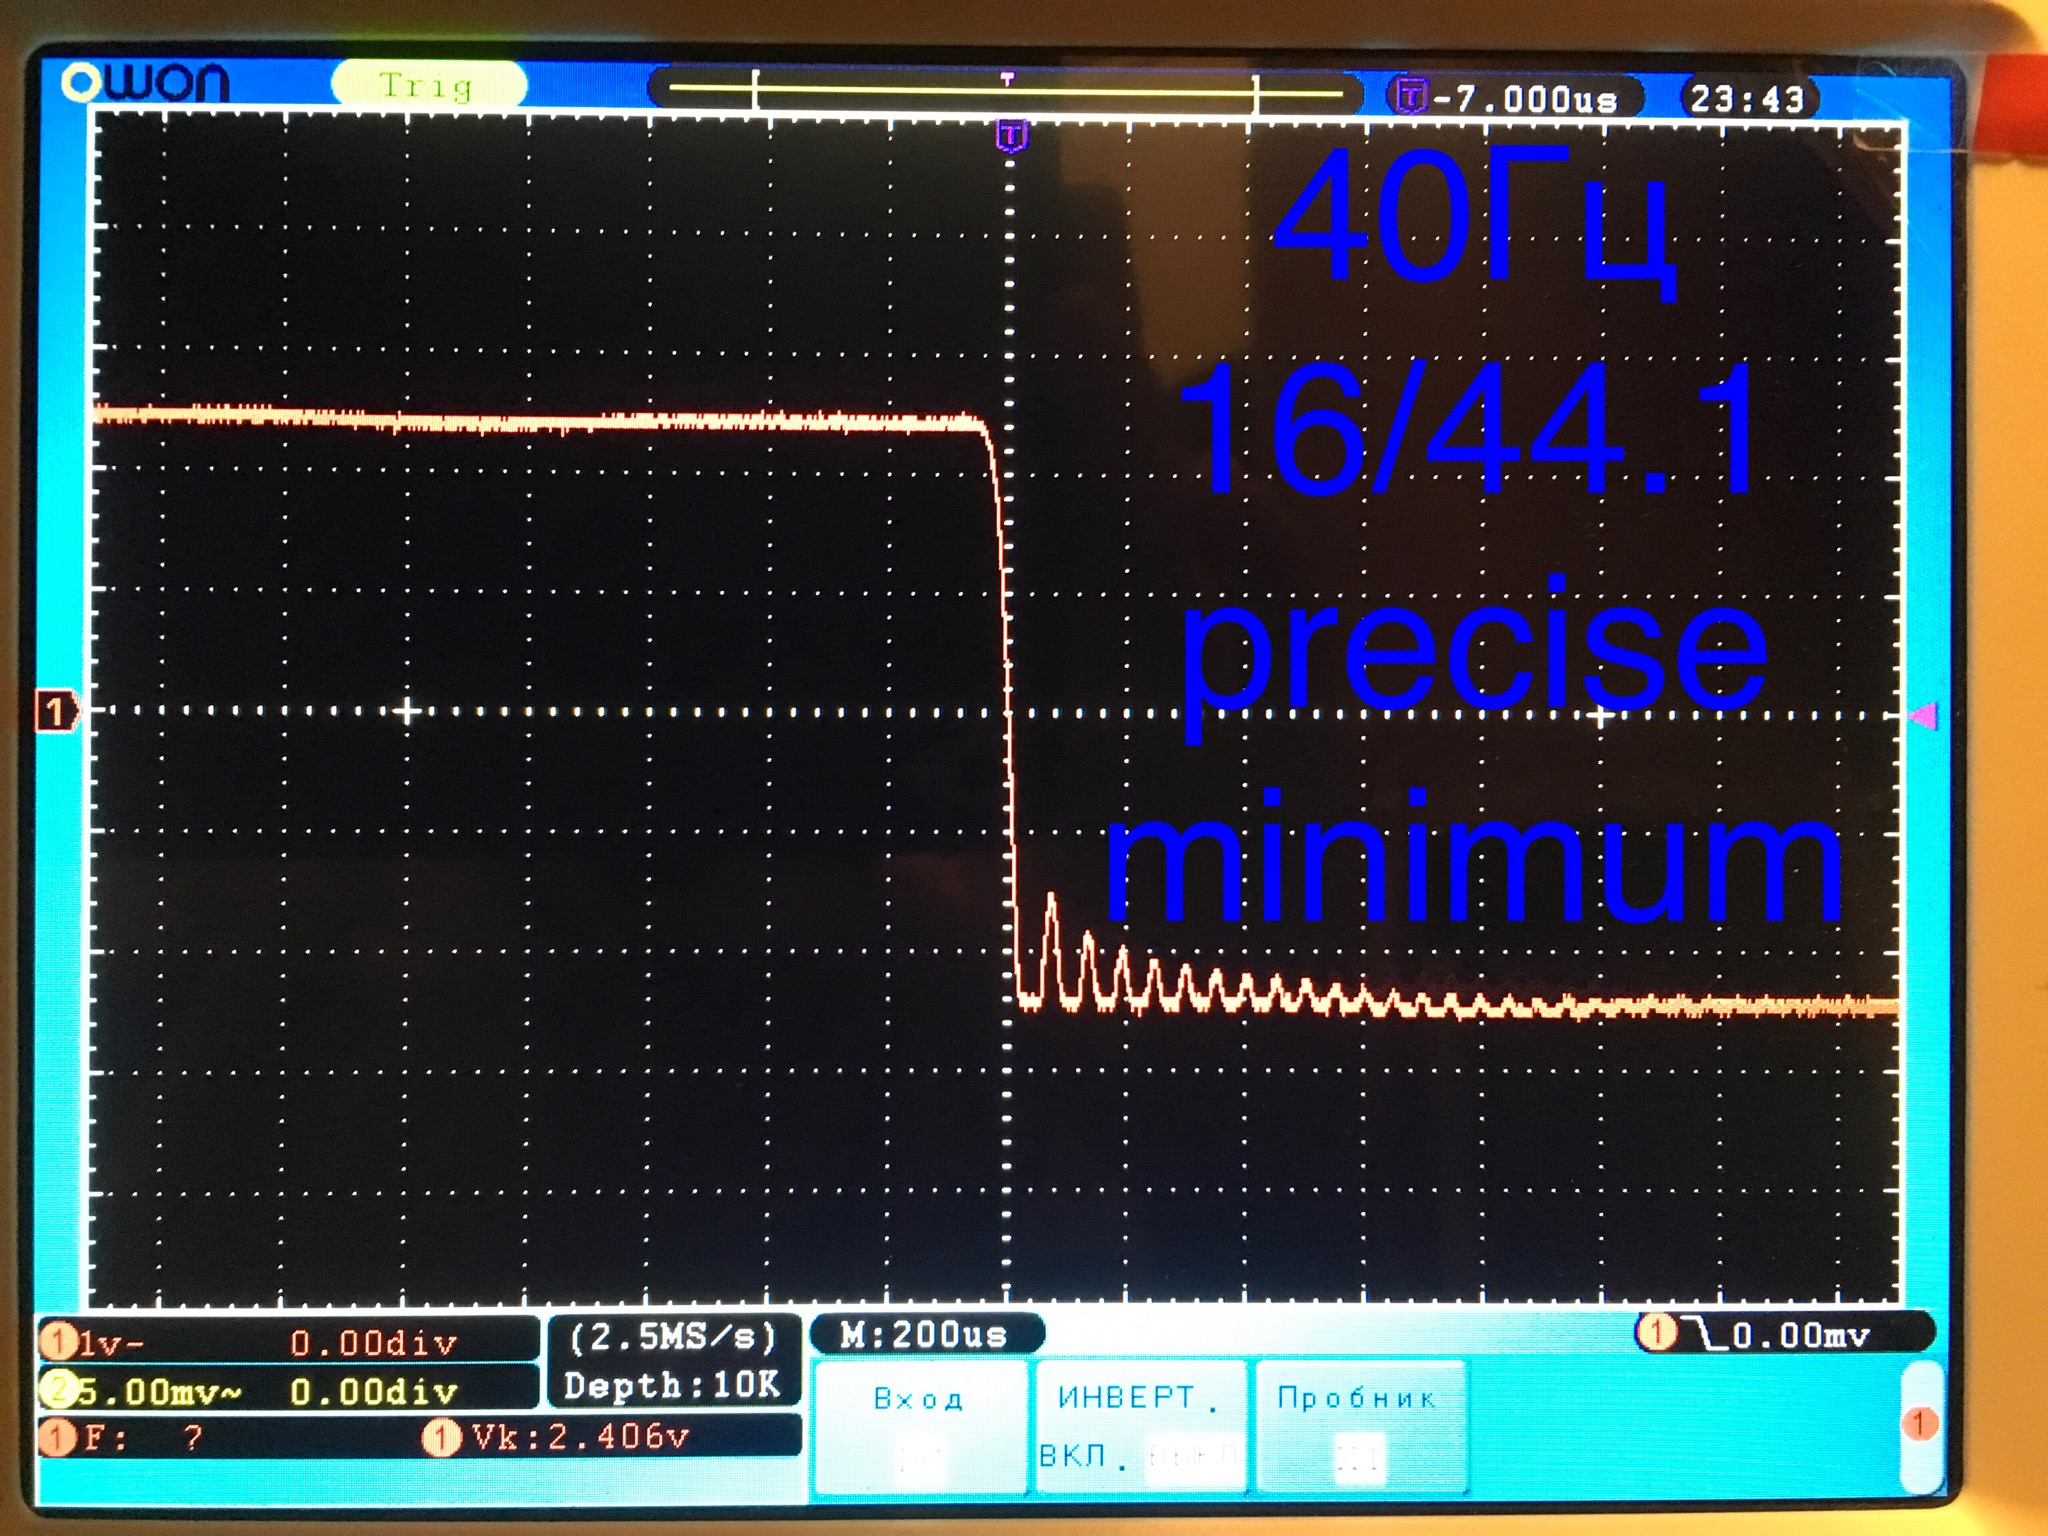
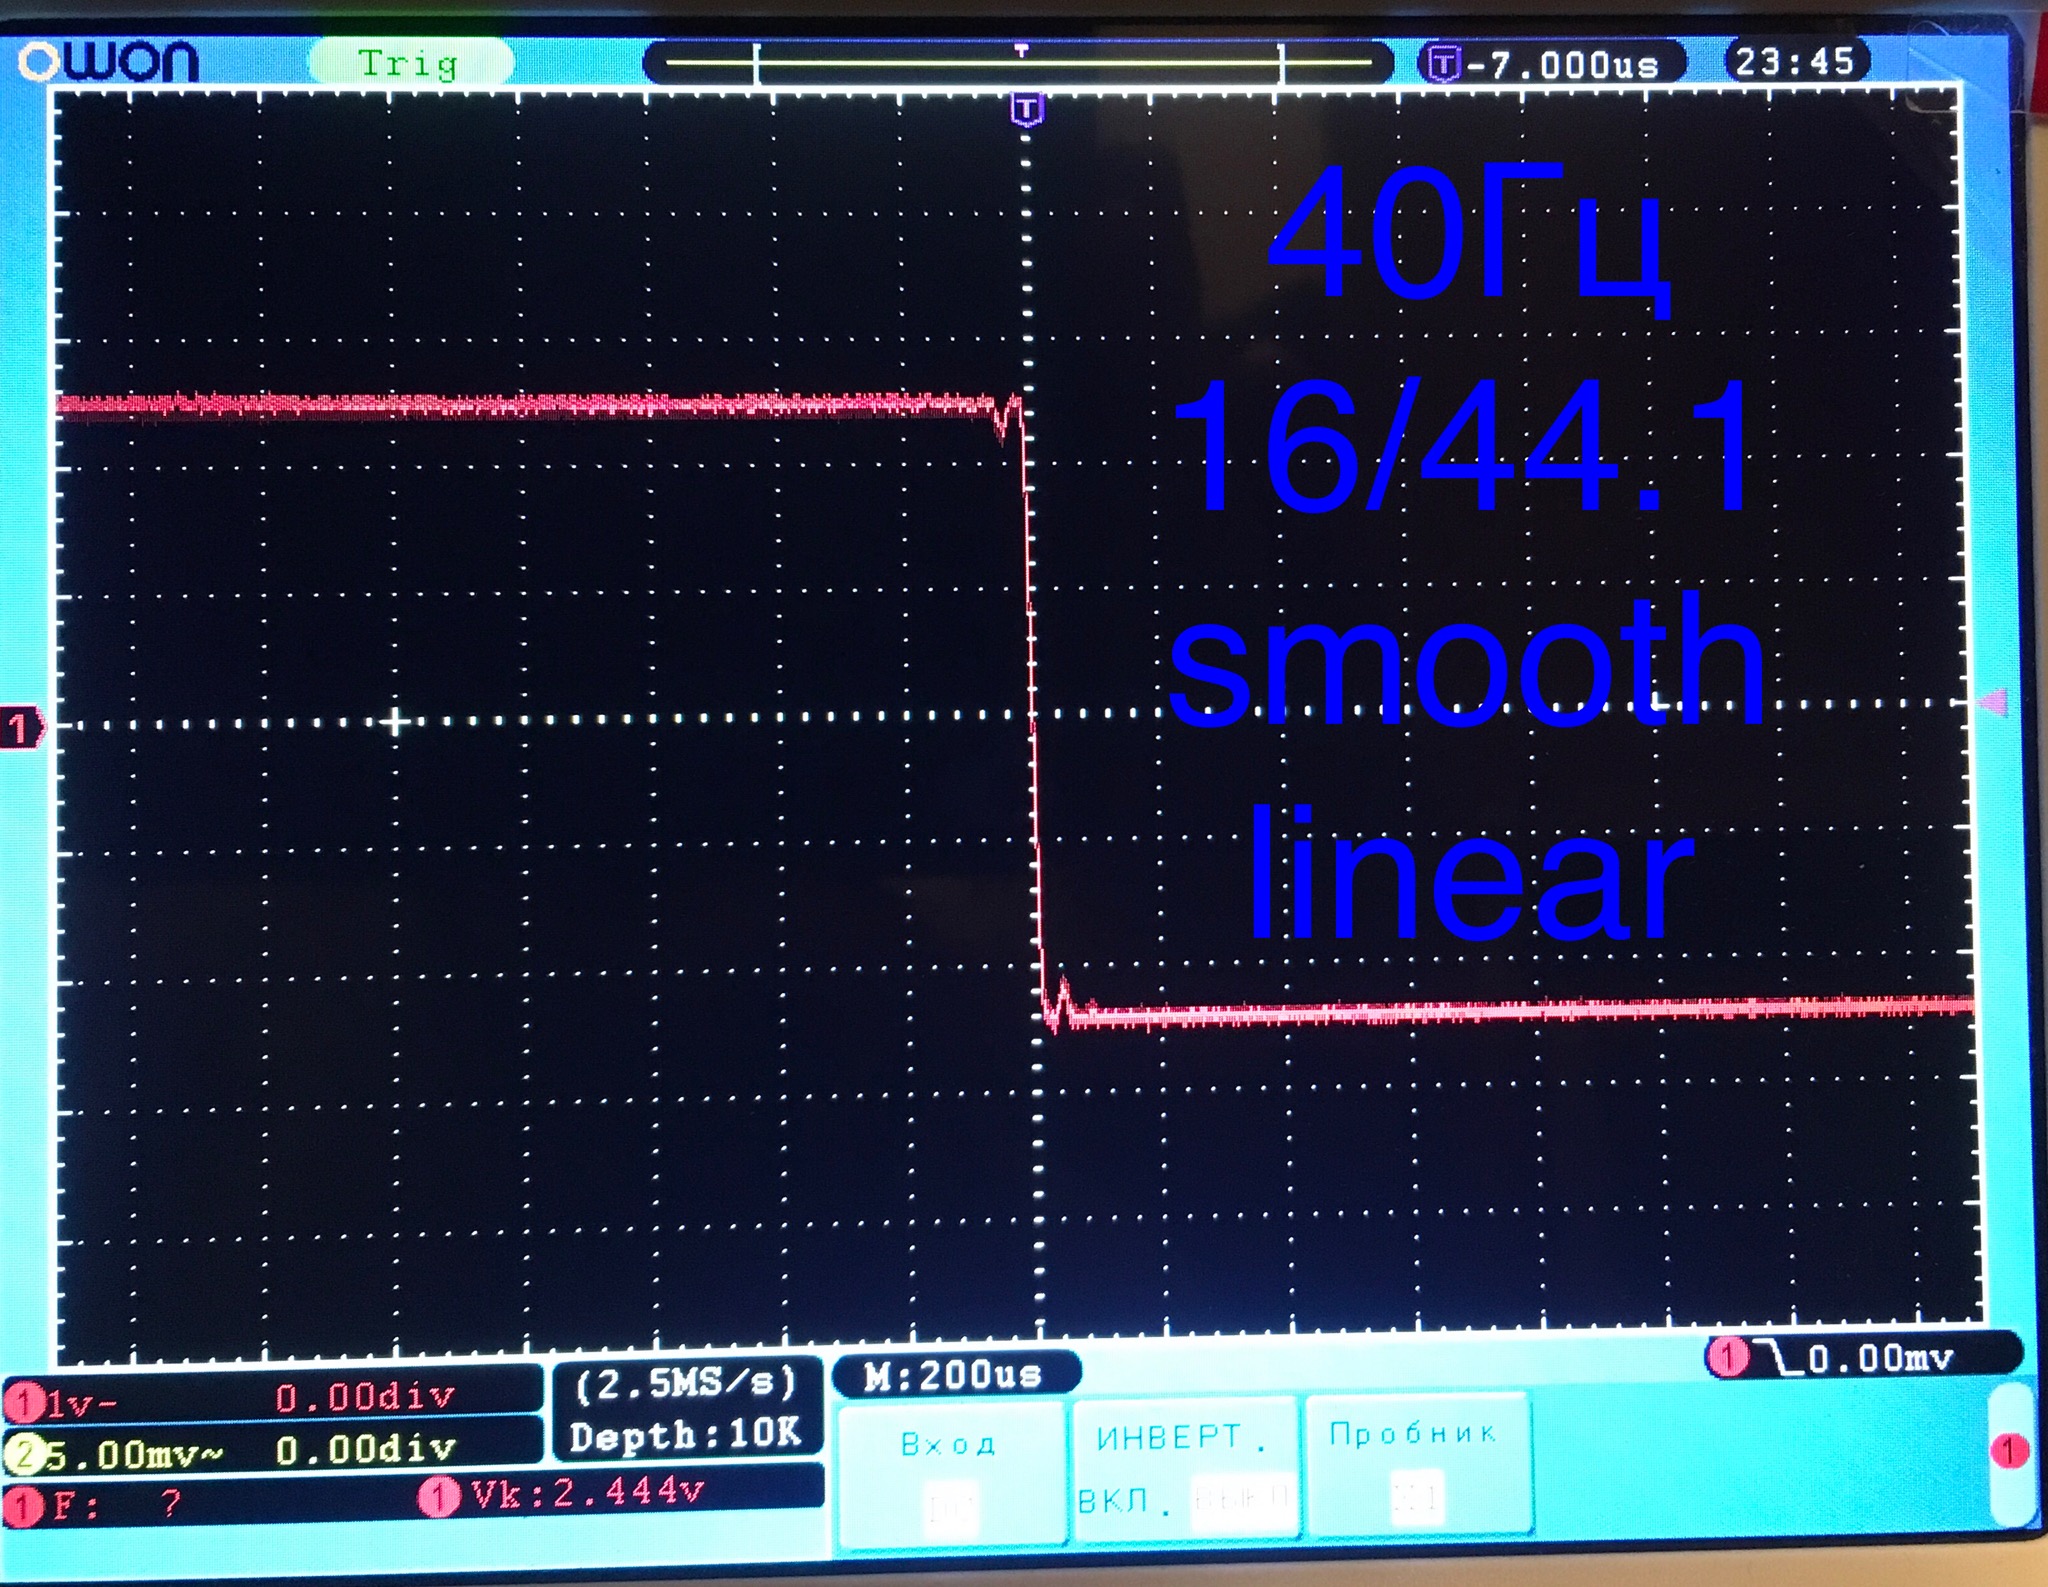
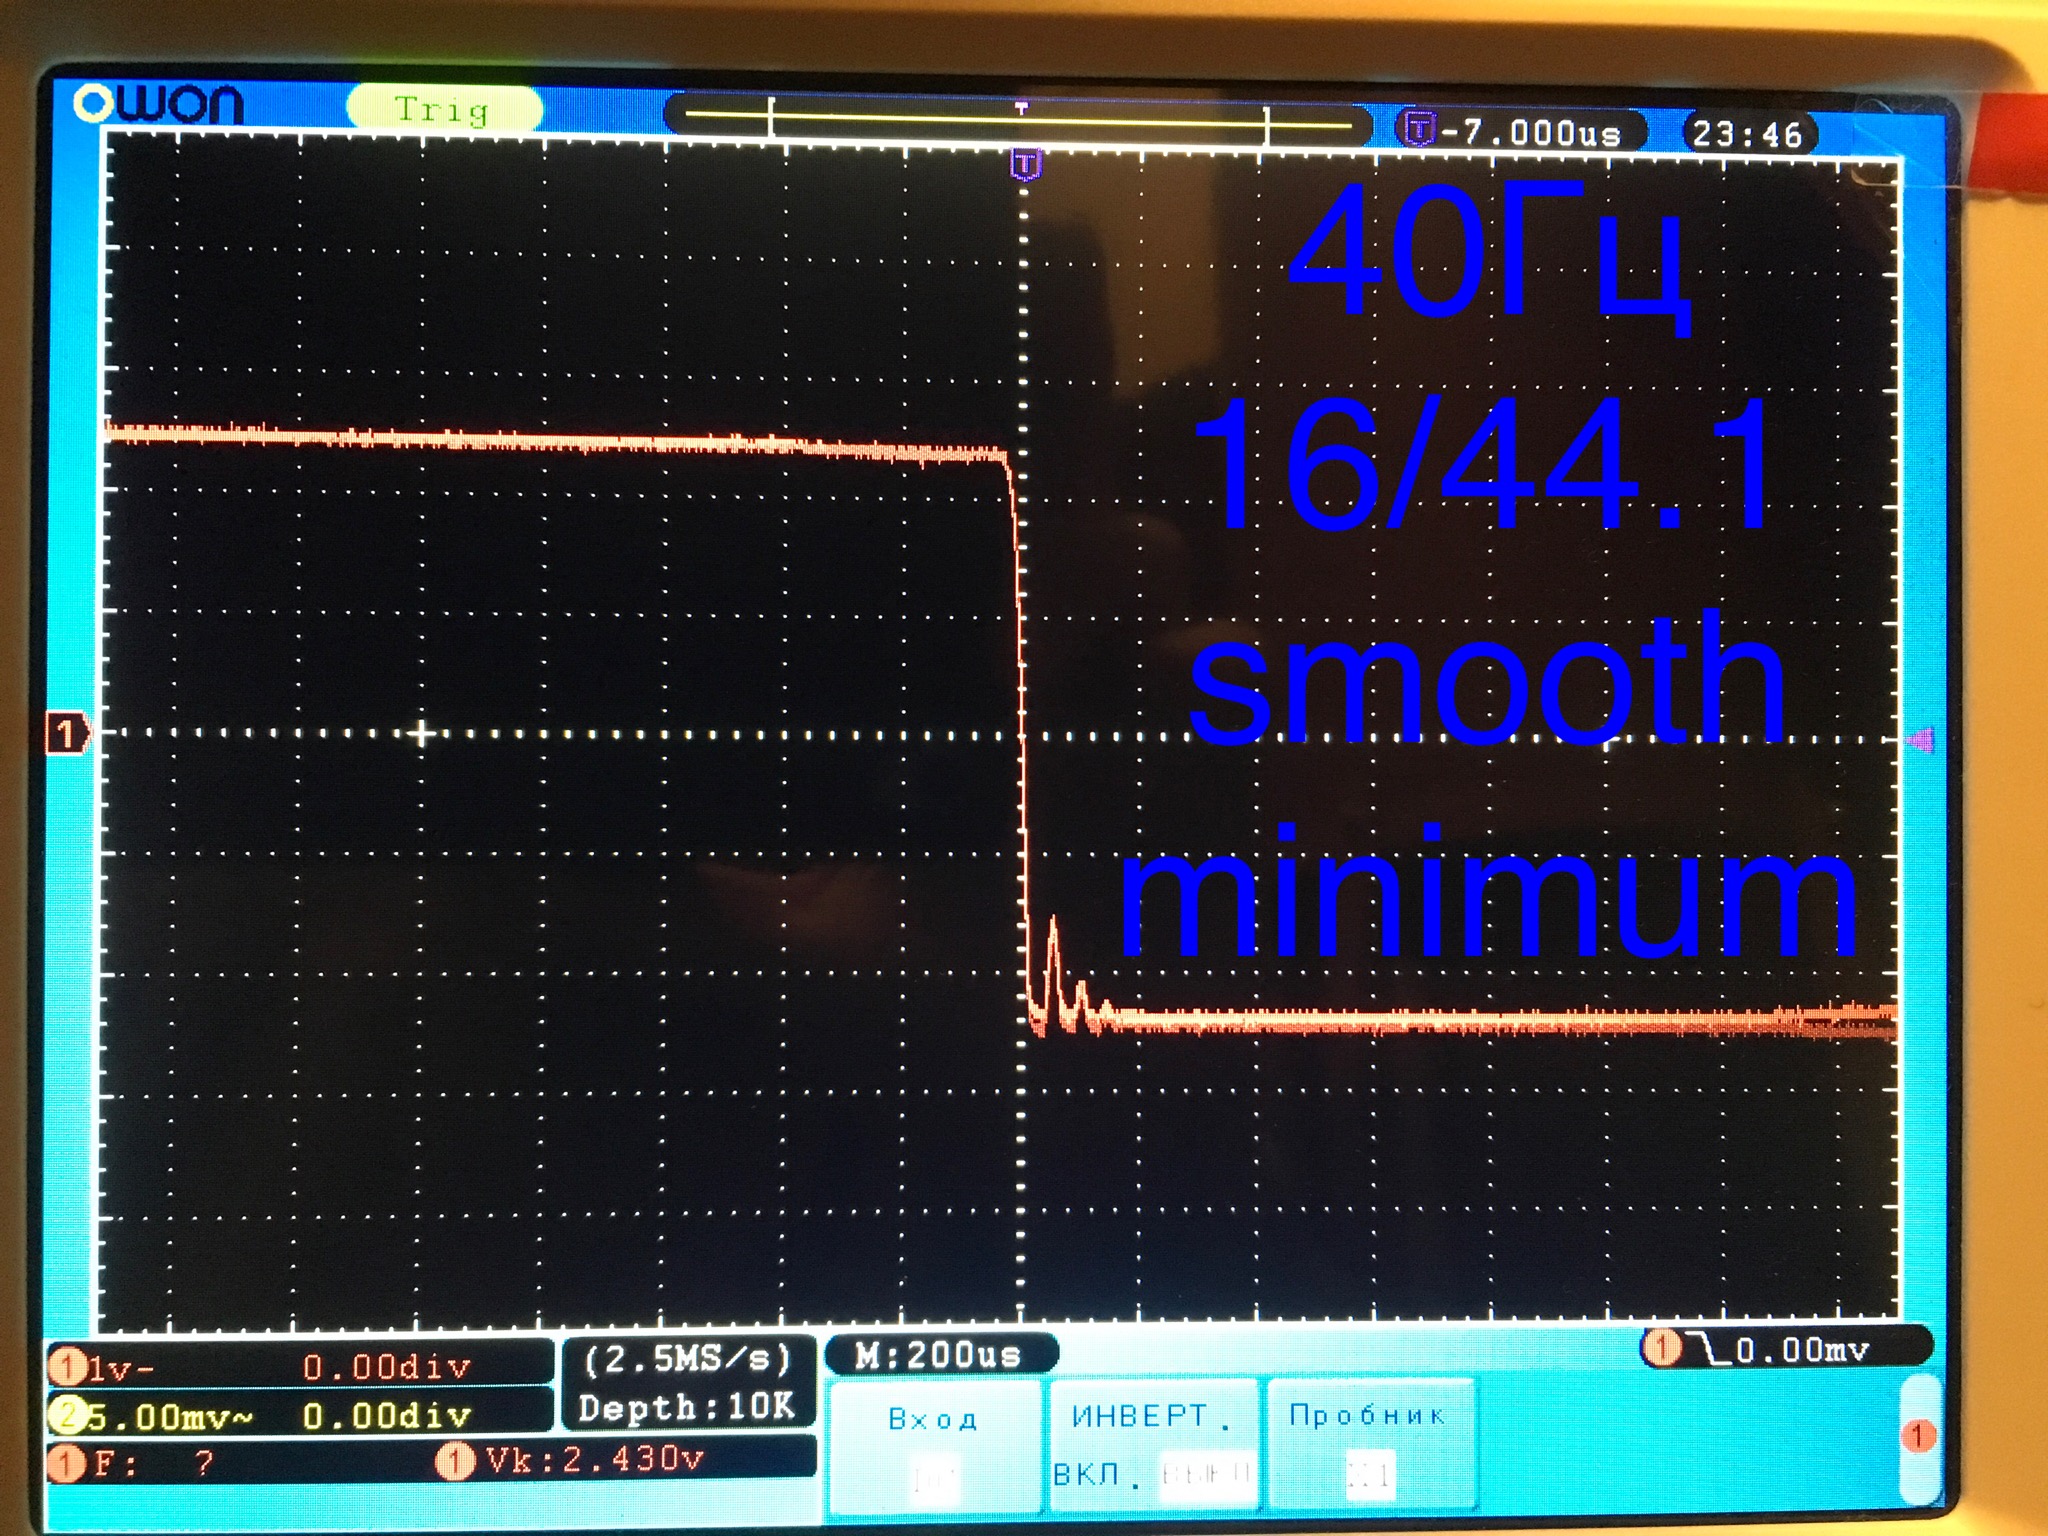
These graphs show the impulse response of the filters — notice the ringing (pre and after the sharp difference in the amplitude of the signal on the meander). And what sound it leads everyone can listen to himself.
Well, it looks like a square wave input, which shows essentially a step response from which impulse response can be seen to some degree. A true impulse with an expanded time scale would help. And frequency domain stuff too.
It seems like Roon would provide a description of each and show graphs that could be compared against, say, the measurements done in Stereophile. Most users aren’t going to know anything from the filter names.
You can find the official documentation for Roon here and here’s the link to the description about the filters which only talks about linear and minimum phase.
@support: Is it possible to complete the documentation about the used filters?
Oh yes. I had found that a few days ago. A start, but pretty thinly covered. Thanks for the request to Support.
This was a pretty technical question, so I’m going to keep the answers at a pretty technical level. A lot could be written on the tradeoffs involved, reasoning behind them, why some of the choices below are valid for music listening (but wouldn’t be for other applications), etc. And there is a lot of basic knowledge of how DSP and sample rate conversion works that would be hard to convey in a short post.
There is a fair bit of religion in this space to contend with in this area, and we do not really subscribe to a particular view. The four filter choices are provided to allow people with a personal bias towards/against minimum phase filters and slow rolloff filters to exercise that preference.
The designs are the the same for the minimum + linear phase variants aside from the phase shift. The designs are also the same (relative to source/target frequencies of course) for all PCM sample rate conversion pairs. So a few plots can paint the picture.
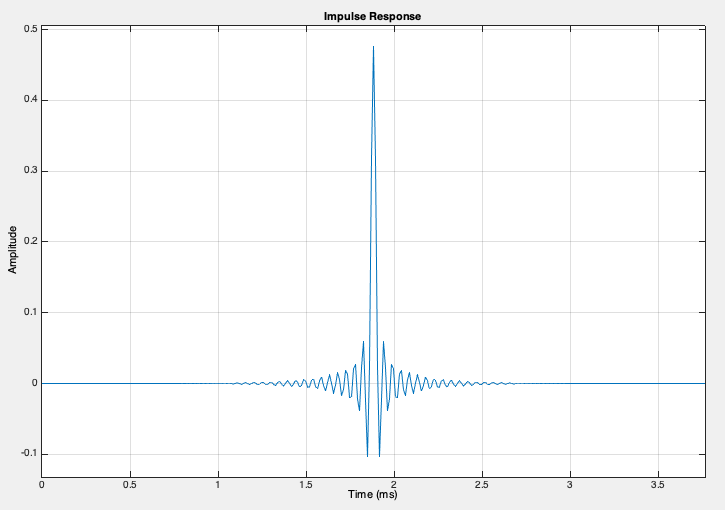
All below plots are for a 44.1kHz -> 88.2kHz upsampling filter. I chose that rate pair to keep the graphs as readable as possible. Also–a real life DAC does not use linear interpolation between samples like MATLAB’s plotting tools. So please ignore the fact that the impulses below look choppy. It has nothing to do with the filters and everything to do with how I generated the plots below.
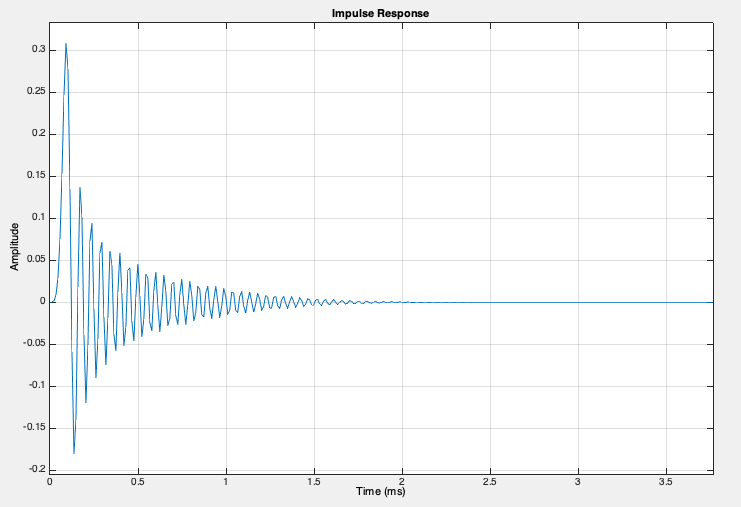
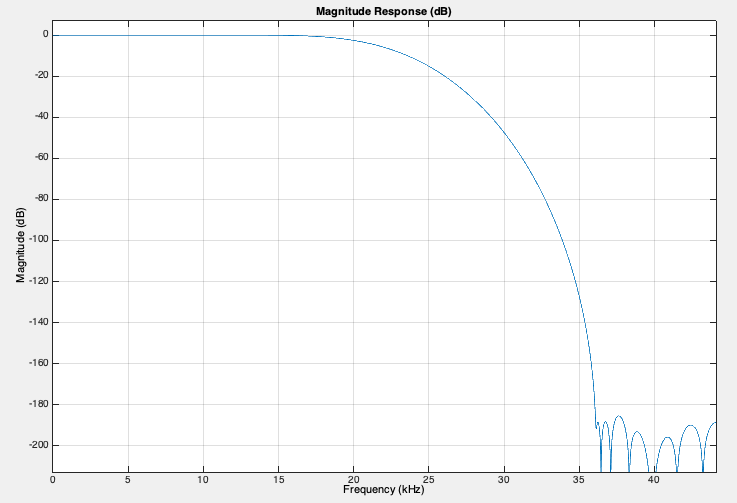
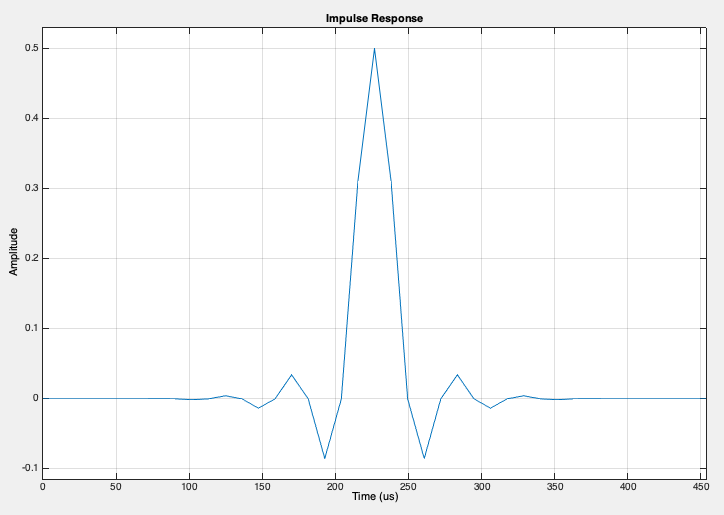
Precise is a steeper filter. It’s called “precise” because in some lines of thinking, the measure of how “ideal” a filter is is primarily determined by how much of the sub-nyquist frequency range is preserved without attenuation. It is not quite a pure “brick wall”. It’s flat to about 20kHz for 44.1kHz source material, and has approx -60dB of attenuation at Fs/2.
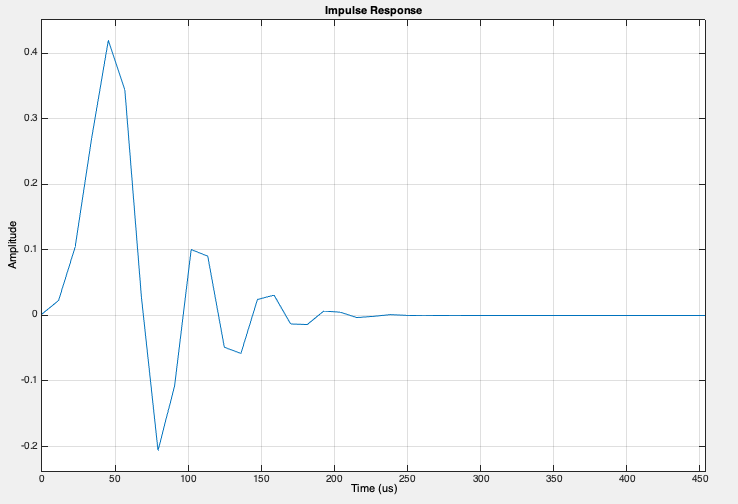
Smooth is a slow rolloff filter. It trades off some attenuation of high frequencies to reduce the amount of ringing. People who agonize over impulse response rather than frequency response plots might prefer this style of filter. This one starts to attenuate pretty early. -0.1dB at 15kHz for 44.1kHz source material, -6dB at Fs/2. It is very leaky, but has a “cleaner” impulse response.
Precise: Frequency Response

Precise: Impulse Response (Linear Phase)
(Sorry for the lack of smoothing in the plot…that is a consequence of the plotting method not a sign of trouble in the filter).
Precise: Impulse Response (Minimum Phase)
(Sorry for the lack of smoothing in the plot…that is a consequence of the plotting method not a sign of trouble in the filter).
Smooth: Frequency Response
Smooth: Impulse Response (Linear Phase)
(Sorry for the lack of smoothing in the plot…that is a consequence of the plotting method not a sign of trouble in the filter).
Smooth: Impulse Response (Minimum Phase)
(Sorry for the lack of smoothing in the plot…that is a consequence of the plotting method not a sign of trouble in the filter).
14 Likes
This is exactly what I was after, Brian! I understand topics like this can set off ridiculous controversies, no matter the reply. But your response answers the question of what the setting descriptions actually mean and can help guide users, along with our ears, in selecting a processing chain that, as you state, exercises our preferences.
Thank you for taking the time to address this in such detail. Another reason to love Roon!
3 Likes