You must observe the log as you are using the system; on my iMac remote I have basically two windows side by side; the Roon app is one (used as a Roon Remote), and a terminal session, connected to my Roon server, is the other…
During ‘normal’ playback and browsing on the Roon app, all is rather well-behaved, and apart from short and expected CPU spikes, nothing impacting is happening. And the latest release does a great job with garbage collection under this usage pattern.
From time to time, and at quite unpredictable moments, Roon starts on the server massive ‘storage library’ processing; this occurs independently for the Qobuz and Tidal collections saved into the database. These processes are very RAM and CPU intensive. Thing is, memory usage never goes down again to a level as before such storage library processing occurs. The log file also reports the number of open file handles, which also go steeply up during this processing, without apparently being released at the end… they stay up.
This processing, which keeps a processor core on the server at 100%, has a notably negative impact on all interaction with the remote’s GUI… page loads, time from clicking on a ‘Play’ button until music reproduction eventually starts, etc etc… all becomes very very slow.
Of course, this storage library processing vastly depends on the number of albums/tracks from Tidal and/or Qobuz you have saved into your Roon database. With smaller libraries, this is done much faster, with larger libraries it takes ever longer, and the impact is ever more felt. My local collection of about 56.000 files has not changed in months, and I don’t ever notice any processing of local files going on. Maybe for those who have vast and growing local file collections, there is a similar storage library process, which I don’t feel, as my local library is rather small and doesn’t evolve.
To me the most interesting observation has been that these storage library processes run very fast after a recent restart of Roon server, but slow down ever more, after Roon has been running for some days. A process that may take initially after a restart about 10 minutes, after two or three weeks of uptime can take hours, all the while keeping a processor core at 100% and such making all GUI interaction insufferable.
It has occurred to me that there may be a massive memory fragmentation, maybe because objects on the big object heap don’t get adequately garbage-collected. I don’t know, this is just my amateur way of trying to interpret what I do observe.
There is one more observation which I find interesting. After a recent restart of Roon server, the nightly backup of Roon’s database brings resource usage massively down again… file handle count and reported RAM usage go down, often even below the initial usage reported after a server restart. But, this is not the case anymore after some days of server uptime. Now the file handle count and RAM usage go down ever less, and, in my case, after a week or so, the backup process has no impact anymore at all on RAM usage and reported file handle count.
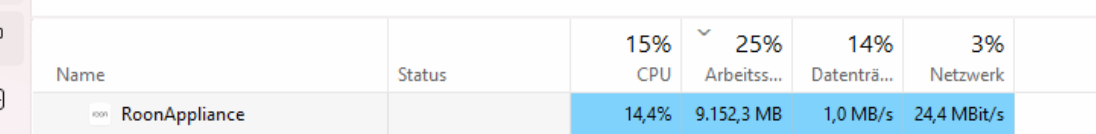
I am now running a database with about 300k tracks, of which 56k are local, the rest divided between Tidal and Qobuz, on a system with 16GB RAM and a Core i5 8600K processor. I can’t remember having seen RAM usage go above 10G; and when this occurs, user interaction with the system has been very slow long before, so a server restart is due.
These are my observations, and I at times have tried to communicate this to Roon support. I don’t feel that there was much interest in these observations, and my personal opinion is that the developers probably know about all this, but to address it would require something similar to a transplant of lungs, heart and liver, all at the same time…