MQA processing speed slower on ROCK than same NUC running Windows (and slower than NAS)

I have two NUC8BEB’s, one running ROCK the other Win 10. I’ve also recently installed Roon on a Synology 1520+. ROCK has been my regular core and I’ve always noticed when streaming MQA from TIDAL that I see a processing speed at the top of the signal path, typically in the 50-60x range. It starts much higher but then drops quickly and plateaus. I was a bit surprised recently when, on playing the same content via the 1520+, that the processing speed in the signal path briefly started in the high 90’s, then disappeared, which I understand means it’s running at > 100x. How could my 1520+ be faster? So I just tried my Windows NUC, same hardware as ROCK, and it behaves the same as the Synology, with no processing speed in the signal path.

Anyone know what’s happening on the ROCK given the hardware is the same as the Windows machine?

1 Like

Did some more tests, and the underperformance of ROCK on a NUC is really quite bad? I took a regular 16-bit album and enabled DSD128 conversion to my Linn streamer and let playback settle down. Results as follows for processing speed:

NUC i7-8559U (2.7MHz) Windows 10 -------------------------6.2x
Synology 1520+ Intel Celeron J4125 2.0MHz -----------------5.2x
NUC i7-8559U (2.7MHz) ROCK----------------------------------2.7x

I built a ROCK i7 NUC on the assumption this was the path to best performance, but it seems this is far from being the case. Maybe will improve with Roon OS 2.0 ?

Could this be the fact that ROCK’s performance settings are conservative due to passive cooling? That’s to say the limits are self imposed to avoid overheating. This is speculation not something I’m sure of…

Interesting idea. Both my NUC’s are on the latest BIOS and as far as I know there are no performance-related differences in the BIOS settings. But it does seem that ROCK is failing to take full advantage of the processing power that is available.

Neither using NUC nor ROCK myself, but …

… it may also be, that ROCK is more efficiently stepping the processor cores to just get the job done.

A better test to determine maximum available processing power might be to max out on available upsampling and other DSP computations until one of the two otherwise identical NUCs poops out.

1 Like

You could check to see if you have more than one core working on other devices which may be the case for the Synology NAS.

I put Ubuntu server on my ROCK NUC, with the database migration it did not take long. The DSD128 conversion test showed a modest improvement from 2.7x for ROCK to 3.3x under Ubuntu, still far below Windows on the same hardware, and quite a bit below the 1520+ (to the extent these numbers mean anything, which I don’t know).

Please provide signal path screenshots.

I have never seen a processing speed just because of MQA. I have to say, I’m very confused why you see one (and my machine has a much slower cpu than your examples).

this is typical of playing MQA to my MQA-certified Vitus streamer if I run the core under ROCK or Ubuntu on my i7 NUC. Identical hardware under Windows does not show the processing speed. On the Synology 1520+, when playback starts it might briefly appear in the high 90’s, then disappears. As posted above with DSP tests, Windows/NUC and the Syno 1520+ appear to be much faster than ROCK.

There are so many variables here. You are comparing apples to oranges.

For example, is your rock’s library scanned/analyzed?

Also, these numbers are not a great indicator of performance. They are an indicator of what’s being done, and not why.

For example, try running two of those zones. Does the number half itself? It will in some cases and not others.

thanks, that’s why I was interested to post my findings, to find out what they mean. In terms of the elements under my control, it is an apples-to-apples comparison, in that all cores and endpoints are wired to the same switch, same scanned library and the DSD conversion test was run on a variety of TIDAL sources. Across a range of content I consistently see that the processing speed on my ROCK i7 NUC is clearly lower than my Syno NAS, and lower still than Windows on an identical NUC. It may be that ROCK is tuned in that way for resource management, or it could be that the processing speed is an irrelevant performance benchmark, but from a user perspective I find it intriguing. Operationally, I find my Syno NAS installation to be very snappy with Roon, so I now have a spare NUC to tinker with.

Ok, I’ll dig in a bit deeper to explain.

First, let me talk about the differences in your CPUs:

The J4125 is a great CPU, fast, inexpensive, but the i7 in the nuc8i7be is a beast compared to it. It can dance circles around that J4125 in so many ways. Another non-obvious properly that your 8th generation i7 is its power management system. It’s a far more flexible system that can really reduce power consumption by slowing down or turning off parts that are unneeded.

Now, let me explain how that processing number works:

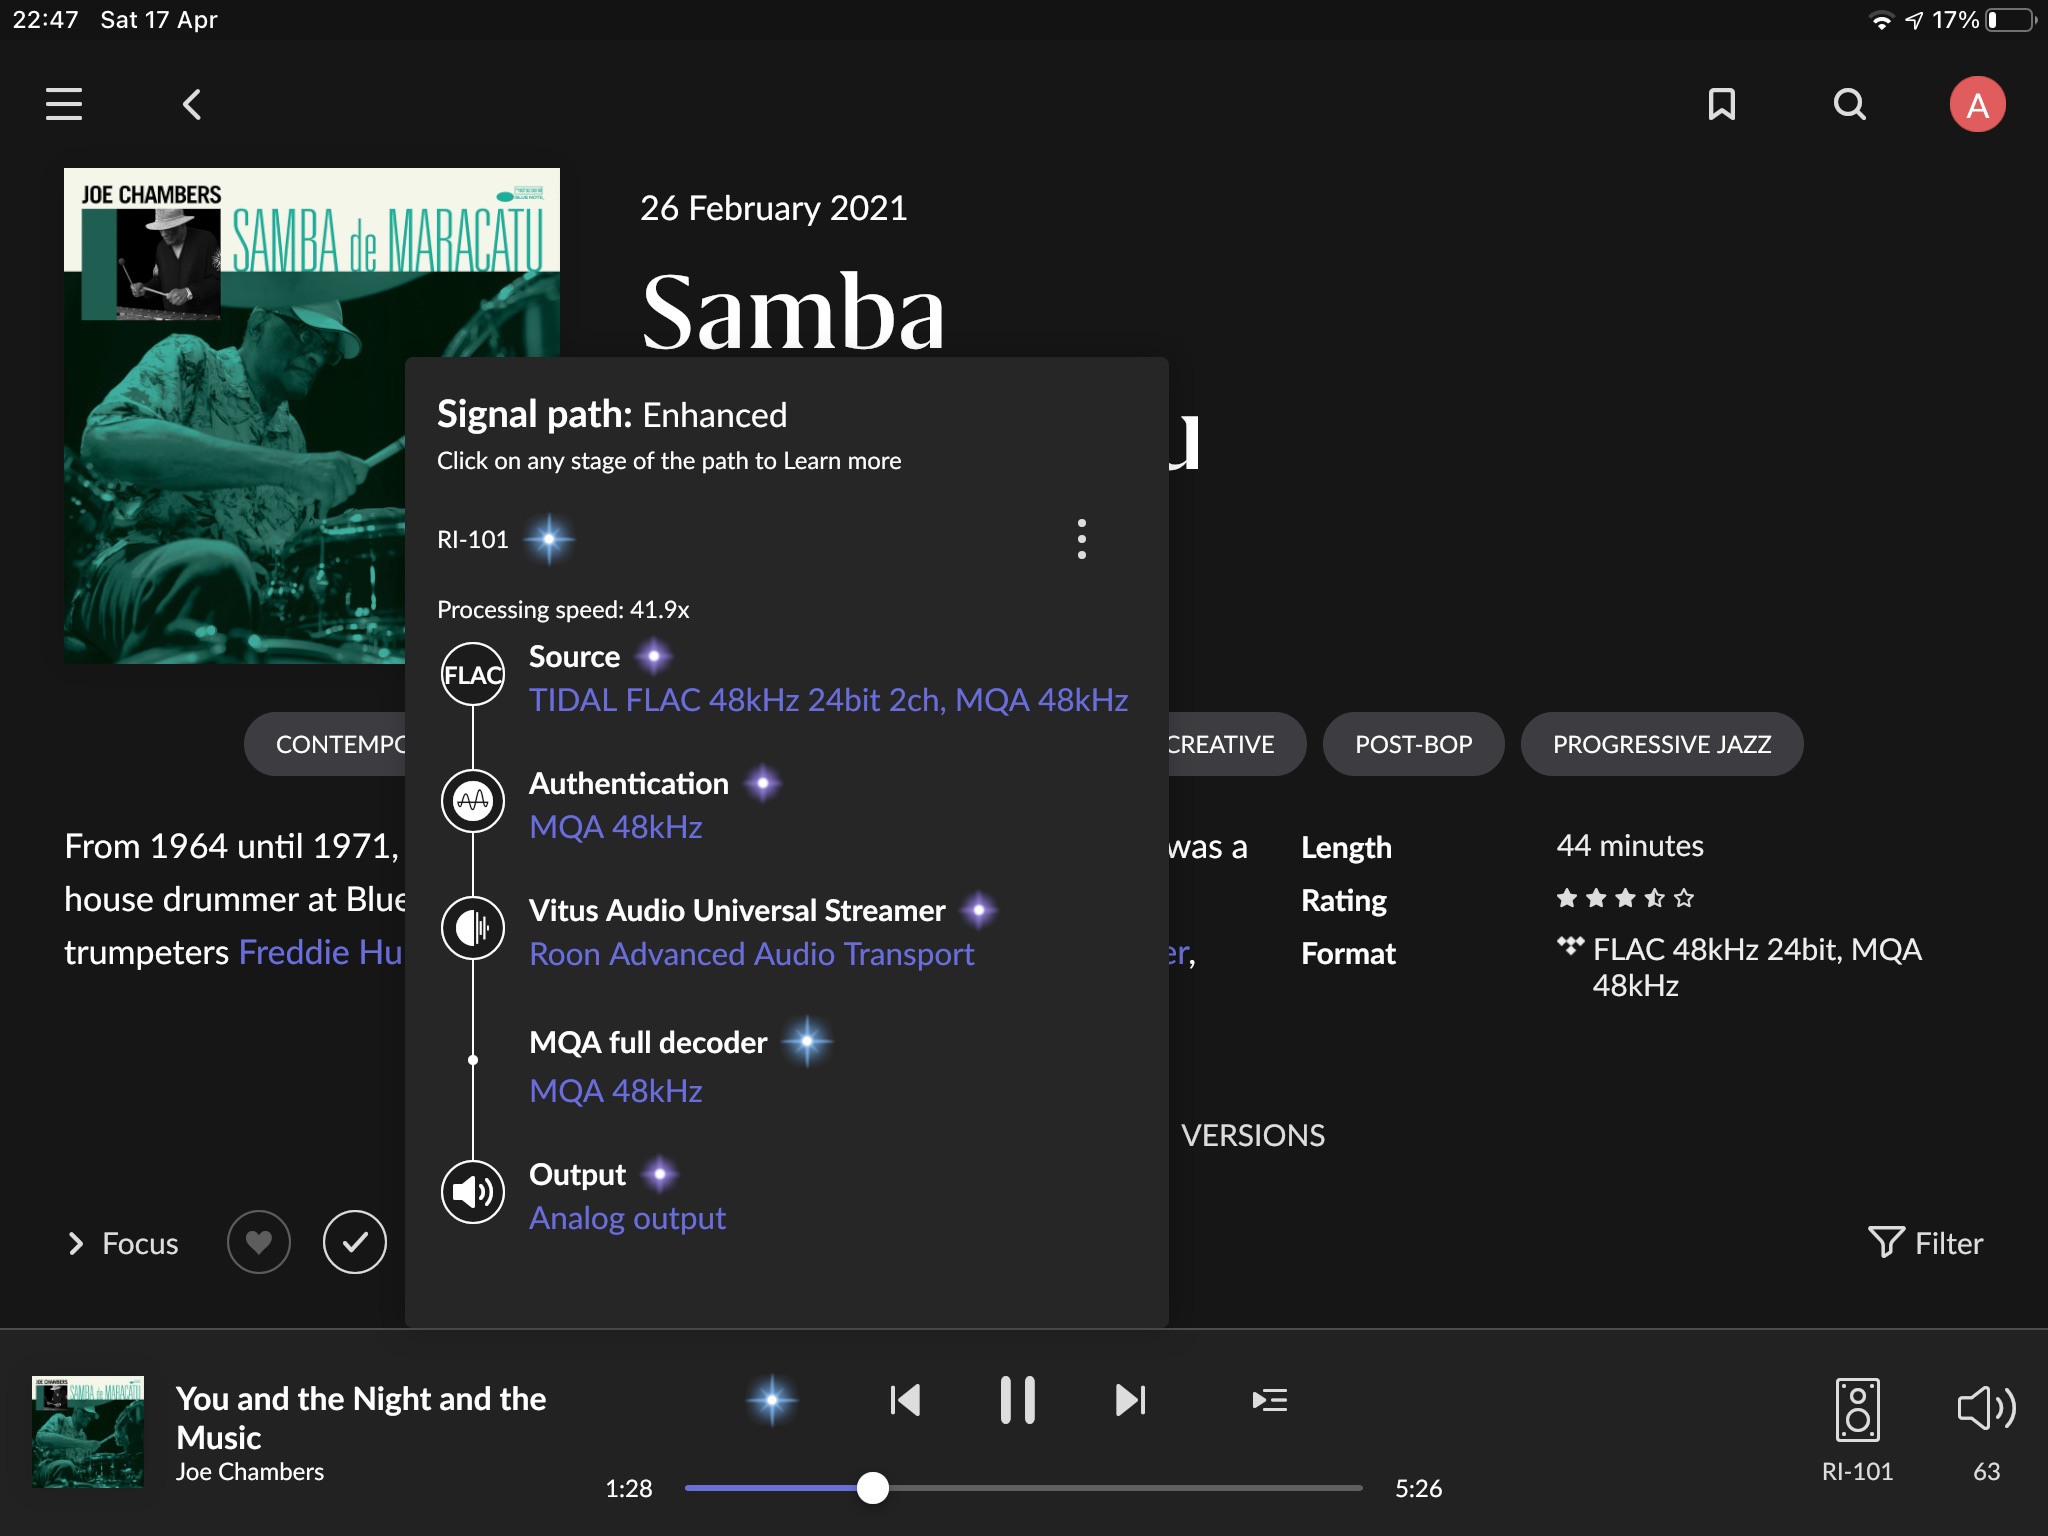
It’s not a measure of computation power, nor is it a measure of how much work is being done vs the capacity of work capable of your processor. It’s just how much time it took to do something in a certain time slice. For example, if it took 10ms to run the DSP for 100ms of your audio stream, then it says “10x”. That’s what I meant by “it’s an indicator of what’s being done”.

While it’s very tempting to say that that’s comparing apples to apples, it’s not when your CPUs are different. For example, that i7 can greatly scale itself down to be much slower than the J4125. In fact, you can run that i7 much slower than the J4125, and it’ll still easily outperform it. That J4125 is more like a traditional car 5 gear transmission and the i7 is like a CVT.

To explain the numbers you see, my guess is that the J4125 is running at full performance when you get those numbers, and the i7 is running at a minimal performance. It’s why I suggested you run two of those zones. I wouldn’t be surprised if the number doesn’t change much on the i7, but does on the J4125. If neither change, try a 3rd zone, or 4th zone, or 5th zone, etc… It will eventually break (go below 1x) on the J4125, and the i7 will keep purring along. That’s why that number is not a good measure of CPU performance.

Your ROCK is running that CPU in a manner to keep that CPU cool, and to keep it idle. There is no point to run it fast when it’s going to spend all it’s time doing nothing. That would just be turning power into heat.

3 Likes

Makes lots of sense. However :innocent: - when leaving the general lots of reserve recommendations, if DSP isn’t important, rooms are unlikely to exceed like two and power saving becomes a less a goal since the device is busy anyway, one could use these Celeron type of CPUs in NASses with a satisfying user experience.

Still I find the Synology Roon core eating more and more RAM the longer it’s up.

Thanks for the detailed commentary, fascinating. How should we account for the substantial difference in nominal processing speed when Roon runs under Windows on an identical NUC? Per my posts above, those differences are even greater.

I take the point that other stress tests would be better indicators of processing capacity, might have a play with that in due course.

Windows runs processors hot. MacOS too. Lots of context switching going on. The Windows machine is always doing a ton more than ROCK. For example, Windows has a ui to deal with!

If the CPU is already doing stuff, it’ll never be allowed to run low speed.

This is the only way to compare the platforms. Unless the system is being thrashed (or core being used hard), then the individual power management setting of the platform will be creating misleading results.

Even then, the values you see may not tell the whole story - different platform have different kernel overheads (windows is much improved these days and OSX seems less good than it was in the past), so a figure of say 1.2x on one platform may not actually be practically comparable to the same figure on another platform because at say 1.2x one platform might start glitching whereas another might remain glitch free down to 1.1x or better. I used to see this comparing DAWs running on OSX and windows on a macbook pro years ago.

I suggested the Roon should have core benchmark built-in so we can evaluate the computation power so we can compare Apple to Apple

Windows processes keep the CPU in high gear, so when MQA decode kick in the CPU is running full speed or turbo boost together with Windows, while ROCK running in low gear as MQA alone 10x processing speed is fast enough for the job and keep the CPU in eco mode that running quiet and cold.

Only let Roon running alone in full throttled before you can doing real world comparison of computation power.

What are you even comparing? CPU performance? There are many tools to do that.

Using this processing number in signal path for measuring performance is just flat out wrong and it can’t be made right.

We can hardly stressed the core to the max, but the DSP engine and processing algorithms update from time to time, hard to gauging real world user experience by a number,

but after benchmark challenged a Roon Core Machine, can give suggestions like maximum Simultaneous playing zone numbers, Library Size, use of DSPs Set, to enhance user experiences with less problems like drop-out, overloaded the core, and stoppage due to slow loading, and decide to upgrading the Roon to meet user needs.