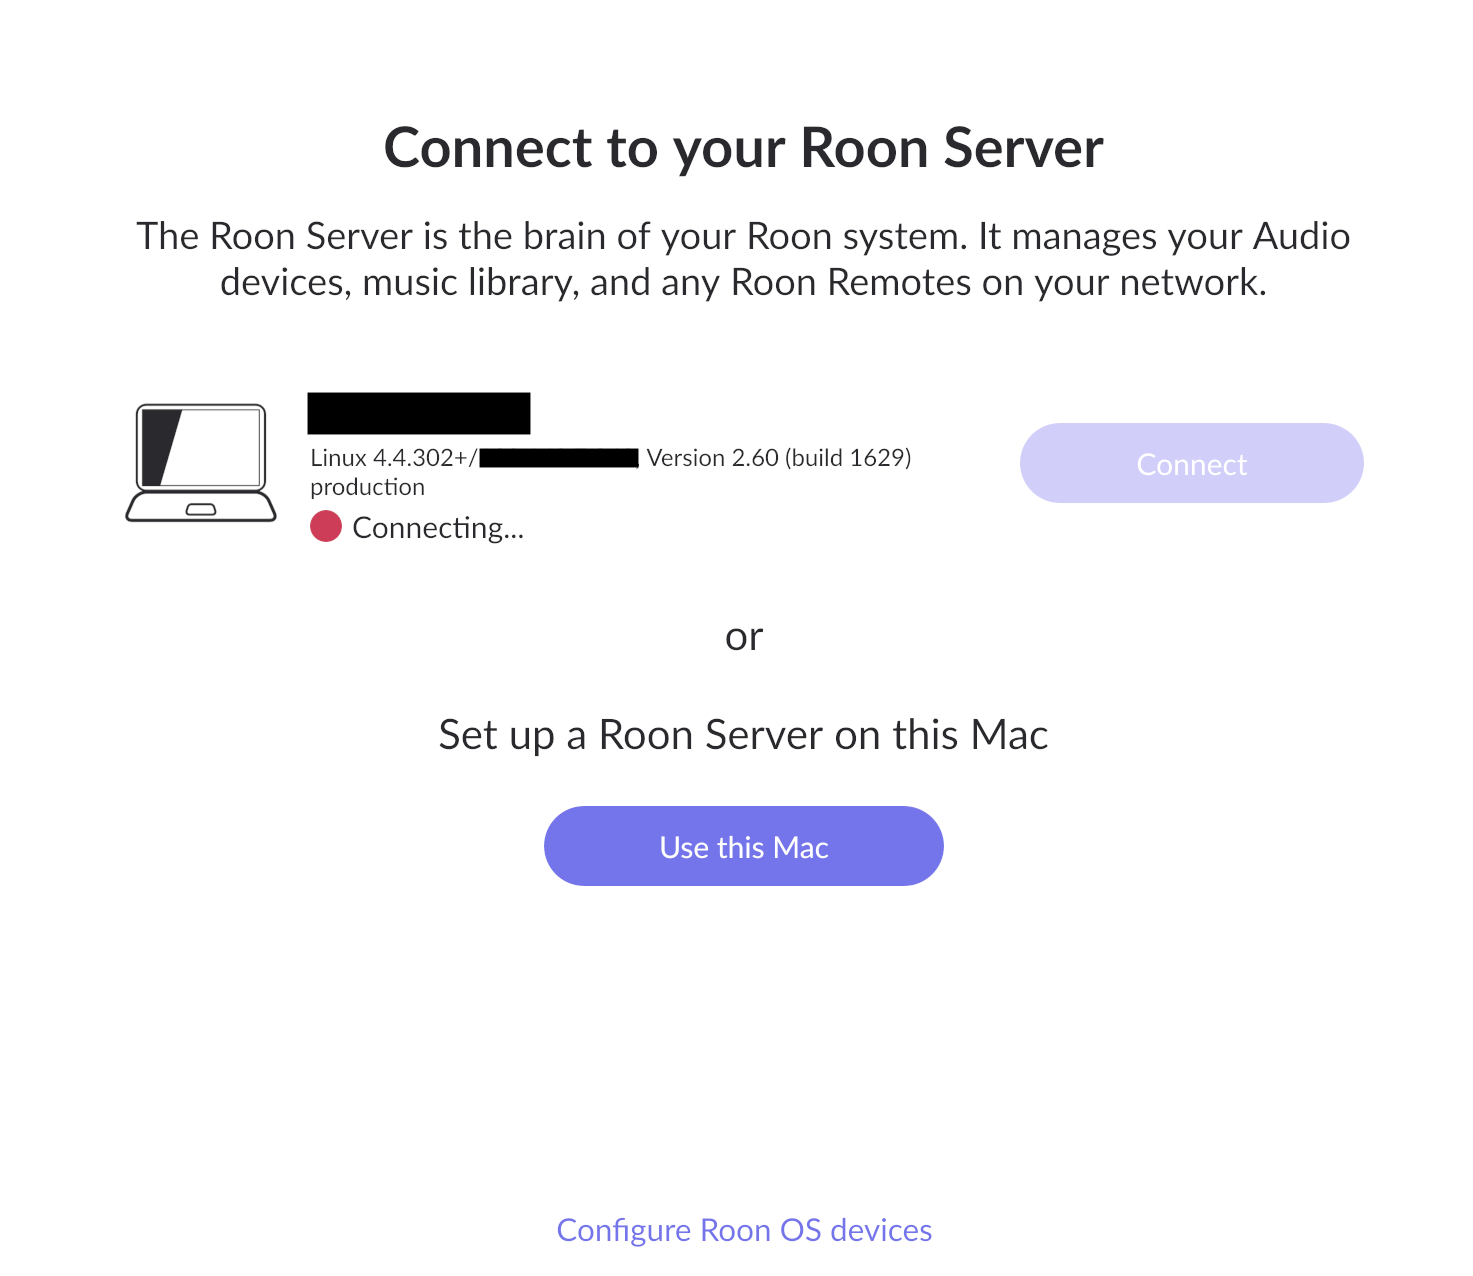
Thank you very much for your detailed suggestions. I went through all of them carefully in the order as given. None of the steps resolved the issue. In all scenarios, when I run Roon on my Mac, it invariably opens up the “Connect to your Roon Server” panel that displays the server on my NAS, with a text block indicating “Connecting…” placed next to a red dot, while the “Connect” button is grayed out.
I would have liked at this point, if I could, to open up the Roon’s Settings window to stop this behavior by removing the Roon server setup, etc, to start afresh, but I cannot open any other window in Roon as long as it is stuck in this “Connecting…” panel.
I wonder if it has something to do with corrupted license credentials or some related cache data, that is outside of the Library > Roon folder(?), but it is just a suspicion on my part. The Roon Server on the NAS seems to work perfectly fine as I can verify by logging out and logging in to Roon app on my iPhone and play some music.
I peeked into what’s in the Library > Roon > Logs on the Mac side, but I couldn’t understand what is going on either.
Hoping that you may shed some light on them, let me briefly summarize what I see in the log file in the following. Thank you in advance,
==== summary below of the Roon log file on the Mac side. (ip address and login credentials are obfuscated for security)
-
After launching, the log file shows some loading activity of openGL-related stuff,
-
followed by a block that looks like:
02/15 17:24:42 Trace: [remoting/remotebrokerv2] [my_NAS] [InitConnection id=371a my_nas_login_name@xxx.xxx.x.xxx:xxxx] Connected.
(??? doesn’t the line above mean the connection is successfully established?)
02/15 17:24:42 Info: [remoting/distributedbroker] FOUND BROKER my_NAS (….)
02/15 17:24:42 Debug: [broker/filebrowser] getpartitioninfo 2 command: /usr/sbin/diskutil, args: info -plist ‘/dev/disk3’
02/15 17:24:42 Debug: [easyhttp] [2] POST to https://discovery.roonlabs.net/1/query returned after 236 ms, status code: 200, request body size: 140 B
02/15 17:24:42 Trace: [SOOD] Adding User IP xxx.xxx.x.xxx
02/15 17:24:42 Trace: [SOOD] Adding User IP xxx.xxx.x.xxx
02/15 17:24:42 Trace: [remoting/remotebrokerv2] [my_NAS] [InitConnection id=3f2c my_nas_login_name@xxx.xxx.x.xxx:xxxx] Connected
-
It is then followed by a large block involving mounted volumes.
-
After that, with the Connect panel still open and indicating it is still trying to connect, the following block ( as bracket by [[ … ]] below) is being repeated indefinitely:
[[ 02/15 17:28:12 Info: [stats] 428548mb Virtual, 649mb Physical, 165mb Managed, 484mb estimated Unmanaged, 0.36% of runtime in GC pauses, 2ms last GC pause duration
02/15 17:28:12 Debug: [easyhttp] [20] POST to https://api.roonlabs.net/discovery/1/query returned after 97 ms, status code: 200, request body size: 140 B
02/15 17:28:13 Debug: [easyhttp] [21] POST to https://api.roonlabs.net/discovery/1/query returned after 100 ms, status code: 200, request body size: 74 B
02/15 17:28:14 Warn: frame took 20.98ms! 19.12ms preframe, 0.00ms safe queue, 0.00ms timers, 0.00ms frame calls, 2.60ms update, 20.98ms render
02/15 17:28:20 Warn: frame took 24.57ms! 19.21ms preframe, 0.00ms safe queue, 0.00ms timers, 0.00ms frame calls, 2.64ms update, 24.57ms render ]]
(??? what does the preframe mean above?)
- BTW, another possibility I was suspecting is that the Roon server somehow black-listed my Mac and thereby refusing to connect? But I don’t see any indication of it in the log file on the Mac side…