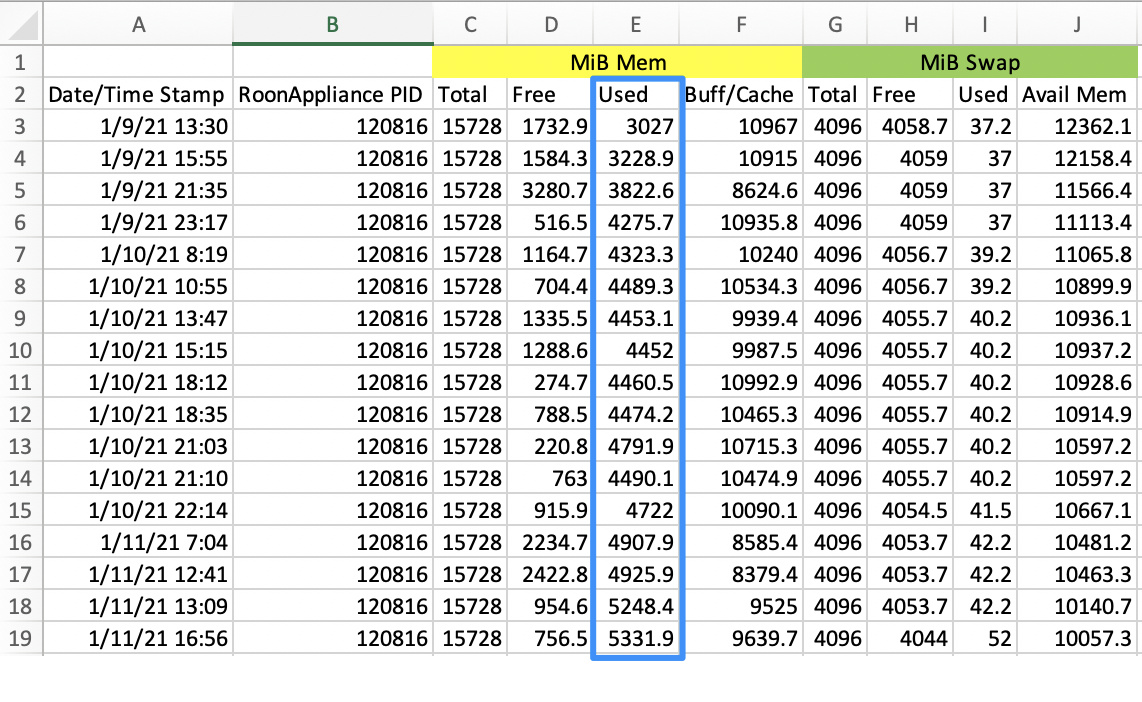
Memory usage on the server has grown steadily from about 3GiB to about 4.9GiB over a period of 48 hours. This is a 62% growth.
I have been playing background music and performing some general browsing this afternoon, I probably have been heavily using Roon for 4 or 5 hours to a single zone with no DSP or other processing. Things are slowing down, memory usage is up and it is getting frustrating but remains usable. I believe that the critical point of used memory that requires a restart of the roonserver process is about 6.5GiB, I am now seeing it at just over 5.3GiB used at idle.
My RoonAppliance process is typically using 5.5-6GB virtual, 1.4GB physical memory. Response is pretty prompt. Most of the machine’s physical memory is being used for buffer cache, which is typical in low memory pressure situations. As with your table, swap is almost unused. So, it’s not memory pressure causing virtual memory thrashing. RoonAppliance must be spinning its wheels somehow on your system.
Those memory readings are taken when the server is idle, nothing is spinning its wheels. There is an issue with memory handling. My definition of idle is there being no activity reported in the log files except for the occasional heartbeat and a memory usage report every 15 seconds.
01/11 19:15:23 Trace: [roonapi] [apiclient 192.168.3.220:34430] CONTINUE Changed {"message":"Running (12)","is_error":false}
01/11 19:15:38 Info: [stats] 8675mb Virtual, 5203mb Physical, 2329mb Managed, 0 Handles, 132 Threads
01/11 19:15:53 Info: [stats] 8675mb Virtual, 5203mb Physical, 2330mb Managed, 0 Handles, 130 Threads
01/11 19:16:08 Info: [stats] 8675mb Virtual, 5203mb Physical, 2332mb Managed, 0 Handles, 132 Threads
01/11 19:16:23 Info: [stats] 8675mb Virtual, 5203mb Physical, 2338mb Managed, 0 Handles, 131 Threads
01/11 19:16:23 Trace: [roonapi] [apiclient 192.168.3.220:34430] CONTINUE Changed {"message":"Running (13)","is_error":false}
01/11 19:16:38 Info: [stats] 8675mb Virtual, 5203mb Physical, 2341mb Managed, 0 Handles, 132 Threads
01/11 19:16:53 Info: [stats] 8675mb Virtual, 5203mb Physical, 2343mb Managed, 0 Handles, 130 Threads
01/11 19:17:08 Info: [stats] 8673mb Virtual, 5203mb Physical, 2346mb Managed, 0 Handles, 131 Threads
01/11 19:17:13 Trace: [library] endmutation in 160ms
01/11 19:17:23 Info: [stats] 8673mb Virtual, 5203mb Physical, 2348mb Managed, 0 Handles, 129 Threads
1 Like
Out of ideas. However much I use Roon, the numbers I gave earlier are what I see.
After Roon doing a backup of the Library, I saw the memory usage was doubled and not freed anymore. I do a backup every 2 days.
I see in your logs, that you have once per minute an API client connecting. What does this API client do?
That is the Ropieee endpoint.
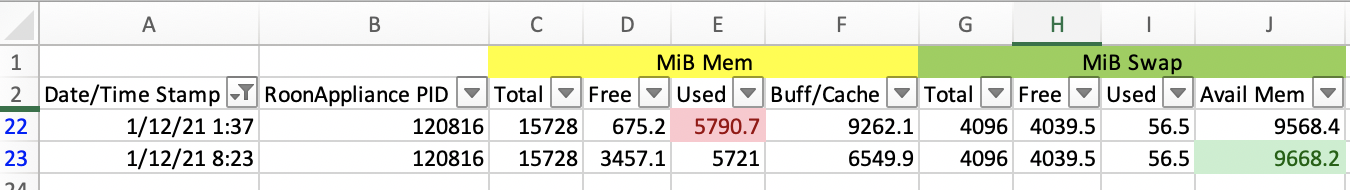
As you can see, about 2hrs 15mins since my last post with log file details the memory usage has increased. I was playing music and browsing my library and Qobuz titles between then and now. I made sure that the server had returned to idle. This growth in memory use just continues over days and results in Roon becoming unusable, at that point I need to restart the roonservice process to return it back to normal functionality. The way things are right now is the interface is very laggy but usable. I am going to continue until it becomes unbearable and then I will perform a restart of the process while recording a screen capture.
01/11 21:32:59 Info: [stats] 9063mb Virtual, 5373mb Physical, 2557mb Managed, 0 Handles, 197 Threads
01/11 21:33:14 Info: [stats] 9063mb Virtual, 5374mb Physical, 2560mb Managed, 0 Handles, 195 Threads
01/11 21:33:29 Info: [stats] 9063mb Virtual, 5374mb Physical, 2561mb Managed, 0 Handles, 195 Threads
01/11 21:33:33 Trace: [roonapi] [apiclient 192.168.3.220:34598] CONTINUE Changed {"message":"Running (17)","is_error":false}
01/11 21:33:44 Info: [stats] 9053mb Virtual, 5374mb Physical, 2563mb Managed, 0 Handles, 190 Threads
01/11 21:33:59 Info: [stats] 9053mb Virtual, 5374mb Physical, 2565mb Managed, 0 Handles, 188 Threads
01/11 21:34:14 Info: [stats] 9053mb Virtual, 5374mb Physical, 2567mb Managed, 0 Handles, 189 Threads
01/11 21:34:29 Info: [stats] 9053mb Virtual, 5375mb Physical, 2575mb Managed, 0 Handles, 187 Threads
01/11 21:34:33 Trace: [roonapi] [apiclient 192.168.3.220:34598] CONTINUE Changed {"message":"Running (18)","is_error":false}
01/11 21:34:41 Trace: [library] endmutation in 189ms
01/11 21:34:44 Info: [stats] 9051mb Virtual, 5375mb Physical, 2578mb Managed, 0 Handles, 188 Threads
01/11 21:34:46 Trace: [broker/accounts] [heartbeat] now=01/12/2021 05:34:46 nextauthrefresh=01/12/2021 05:39:47 nextmachineallocate=01/12/2021 08:39:46
01/11 21:34:59 Info: [stats] 9051mb Virtual, 5375mb Physical, 2579mb Managed, 0 Handles, 186 Threads
01/11 21:35:11 Trace: [library] endmutation in 185ms
01/11 21:35:14 Info: [stats] 9049mb Virtual, 5375mb Physical, 2582mb Managed, 0 Handles, 186 Threads
01/11 21:35:29 Info: [stats] 9045mb Virtual, 5375mb Physical, 2583mb Managed, 0 Handles, 183 Threads
01/11 21:35:33 Trace: [roonapi] [apiclient 192.168.3.220:34598] CONTINUE Changed {"message":"Running (19)","is_error":false}
01/11 21:35:44 Info: [stats] 9041mb Virtual, 5376mb Physical, 2585mb Managed, 0 Handles, 183 Threads
01/11 21:35:45 Trace: [library] endmutation in 186ms
01/11 21:35:59 Info: [stats] 9041mb Virtual, 5376mb Physical, 2587mb Managed, 0 Handles, 181 Threads
1 Like
No word from @support on this issue? I believe that there is a lot of evidence provided here and it is worthy of an acknowledgement from Roon.
Most recently the server sat for about 6 hours over night not doing anything. While the used memory did drop and available free memory did increase it did not return to a level anywhere near close to the previous night.
2 Likes
The Roon service appears to be becoming unstable, I have had a couple of disconnects in the past 12 hours, most recently this was documented in the log files while Roon Radio was playing.
01/12 11:40:28 Trace: [rnet/RnetJsonClient] no data received for >10000ms. Killing connection.
01/12 11:40:28 Warn: [rnet/RnetJsonClient] error writing to connection
01/12 11:40:28 Trace: [raat_ll/client] [Qutest] no data received for >10000ms. Killing connection.
01/12 11:40:28 Trace: [raatserver] [RaatServer ropieeexl @ 192.168.3.220:42621] lost client connection. Retrying
01/12 11:40:28 Trace: [raatserver] [RaatServer ropieeexl @ 192.168.3.220:42621] connecting (attempt 1)
01/12 11:40:28 Info: [transport] destroyed zone Living Room was playing? True
01/12 11:40:28 Trace: [zone Living Room] Suspend
I note that the Spockfish extension had become disabled and had to be enabled manually in the Roon interface.
Hi @Robem,
Apologies for the delay here! We are still catching up a bit from the holidays, but we’ve scheduled a meeting to discuss this with our team this week. We’ve enabled diagnostics and we’ll follow up when we have feedback for you. Thanks!
Just an update on my testing of Roon Core on Ubuntu Server 20.04.1 LTS.
I have not been able to detect any problems with Roon on my machine.
Roon have been running stable, also when i testet other software (testing monitoring agents).
Memory consumption does not drop and CPU usage is very modest.
My library is on the same ssd as the OS is, and has a modest 500 albums.
Thank you for the acknowledge Dylan.
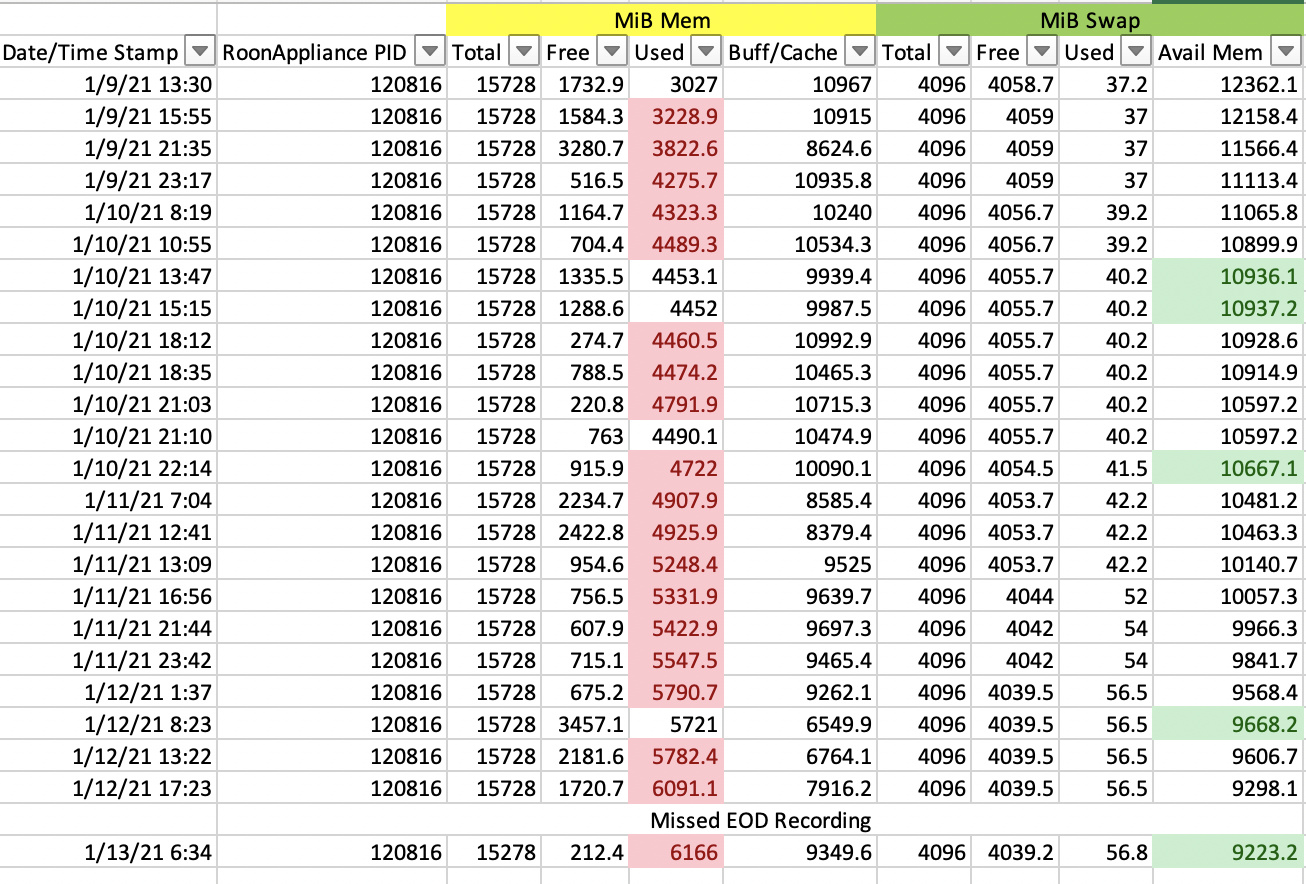
I actually retired for the evening before Roon had been finished being used, so I was not able to record memory usage at end of day yesterday but I was able to grab it this morning. Usage last night was pretty light and even still the used memory has clearly grown. Also, a few times (once starting at about 18:40) we had extreme remote slowness and reduced ability to search etc.
Here is a screenshot of my latest memory usage tracking.
Hi @Robem,
Can you please create a .zip archive of your current RoonServer/Logs directory and send this file to us via Dropbox / Google Drive / etc? We would like to have a full set of logs in case the team needs additional context here.
Also, it would be helpful if we could try a fresh database, just to see if this issue still reproduces on the same hardware or if the issue is database-specific. For the fresh database please use a small amount of local tracks + Qobuz/TIDAL.
You can switch fairly easy to a new database by exiting out of Roon/RoonServer and then renaming the RoonServer directory to RoonServer_old and then restart RoonServer. Then at the end of testing you can rename the directory back to get the old database.
Please send logs and verify the fresh database aspect when possible so we can include this info for the team, thanks!
Thank you @noris for getting back to me. Something has come up and I am now out of town for a bit. I just tried talking someone remotely through pulling the log files for me and that didn’t go too well. Hopefully you have enough to get going on until I can return and get my hands on the server myself.
1 Like
Hello @Noris and @dylan , I have had some time while traveling to consider my options regarding this issue. There is a viable workaround that I can put in place that will minimize the impact of this memory growth. Additionally I have put considerable time effort in already into documenting the symptoms and I feel that you and your team have an understanding of where we are right now. I honestly do not want to go down the rabbit hole of recreating a small library and following up on log files etc. any more than I have to. I think that you really have enough info here to recreate this in a lab environment.
With that in mind, I will be backing out of this conversation and implementing a workaround of restarting Roon on a nightly schedule so that my experience is not reduced to frustration. I will keep an eye on future releases to see if there is a sign that I might one day be able to remove the task from the crontab.
As such, can you please remove the diagnostics from my account and when I am able I will setup a roonserver restart every 24 hours so that I can just enjoy the music?
Thanks!
3 Likes
Hello @Robem,
Thank you for your feedback here and for all the documentation of the issue you have provided in this thread!
It is unfortunate that we can’t test for the issue on a smaller library in the same enviorment, but we will try to go on what details we have from you for now.
When we last spoke, I also activated diagnostics mode and what this does is upload a log set for review to our servers. Previously, your Core wasn’t delivering this report, but I do see that a log report has been delivered in the meantime.
I will go ahead and submit the additional details and logs to QA, hopefully this will be enough info to try and reproduce the issue, thank you!
Should this be resolved with the latest update?
1 Like
This topic was automatically closed after 197 days. New replies are no longer allowed.