RoonAppliance Memory Leak Observed Over Past Week (ref#49GPB2)

What’s happening?

· Other

How can we help?

· None of the above

Other options

· Other

Describe the issue

RoonAppliance memory leak. See screenshot. Very clearly over the past week shows a memory leak. When checking `top`, RoonAppliance is consuming 99% of memory. When the memory usage drops on the chart, this is from Roon being manually restarted (annoying).

Describe your network setup

Entire network is Cisco, Roon Core is running on ESXi - Ubuntu 24.04 LTS virtual machine

Guys, this is crazy - see screenshot below:

image

Throwing more memory at the VM makes the problem worse. Please let me know what you need from my end in order to debug this - clearly there is a memory leak here, and it is quite a doozy indeed!

Roon doesn’t support virtual machines or containers, so I have moved this thread to tinkering.

If you can replicate the issue with a native install, Roon would take a look.

FWIW, I run Roon Server in a custom Podman, and container don’t see thus behaviour (I also have a native install, that I run in demand for occassions where I need support.)

Appreciate the response but that makes absolutely no sense?

What do you mean Roon doesn’t support virtual machines?

Also, there are threads all over this forum about memory leaks and even a latest update that just fixed a memory leaks (sadly not this one!)

Logically there is no difference between code running on an x86 physical machine and a virtual one. Virtual machines can process audio too! :grinning_face_with_smiling_eyes:

This is not tinkering - this is installing Roon core with the scripts from the official website, on a very common operating system and distro at that!

1 Like

It’s Roon policy that VMs and containets are an unsupport platform configuration. Therefore, Tinkering is where you may find community support and assistance.

This is a complicated topic.

Roon is written in C#. C# programs use garbage collection as a memory strategy. This means that a C# developer doesn’t write code explicit code to free memory. They allocate and use objects and then stop using them when they’re no longer necessary. Sooner or later, the “garbage collector” kicks off, figures out what objects are no longer in use, and “frees” them.

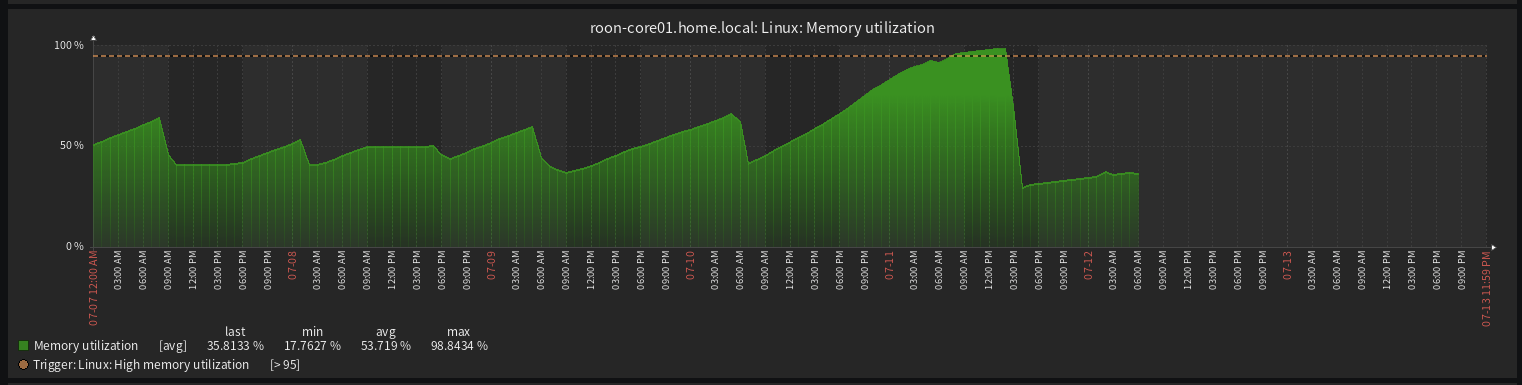
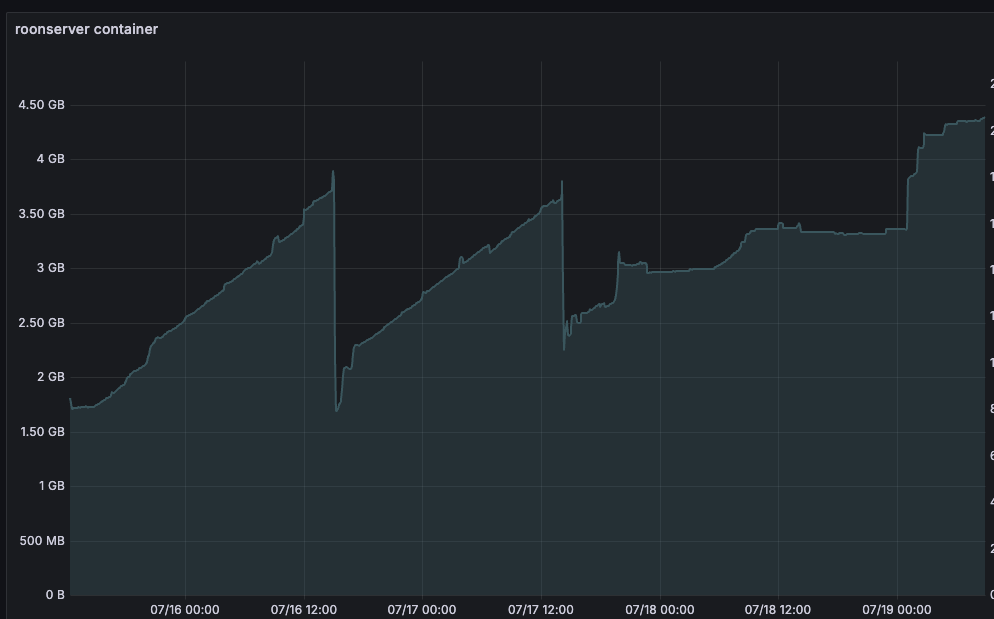
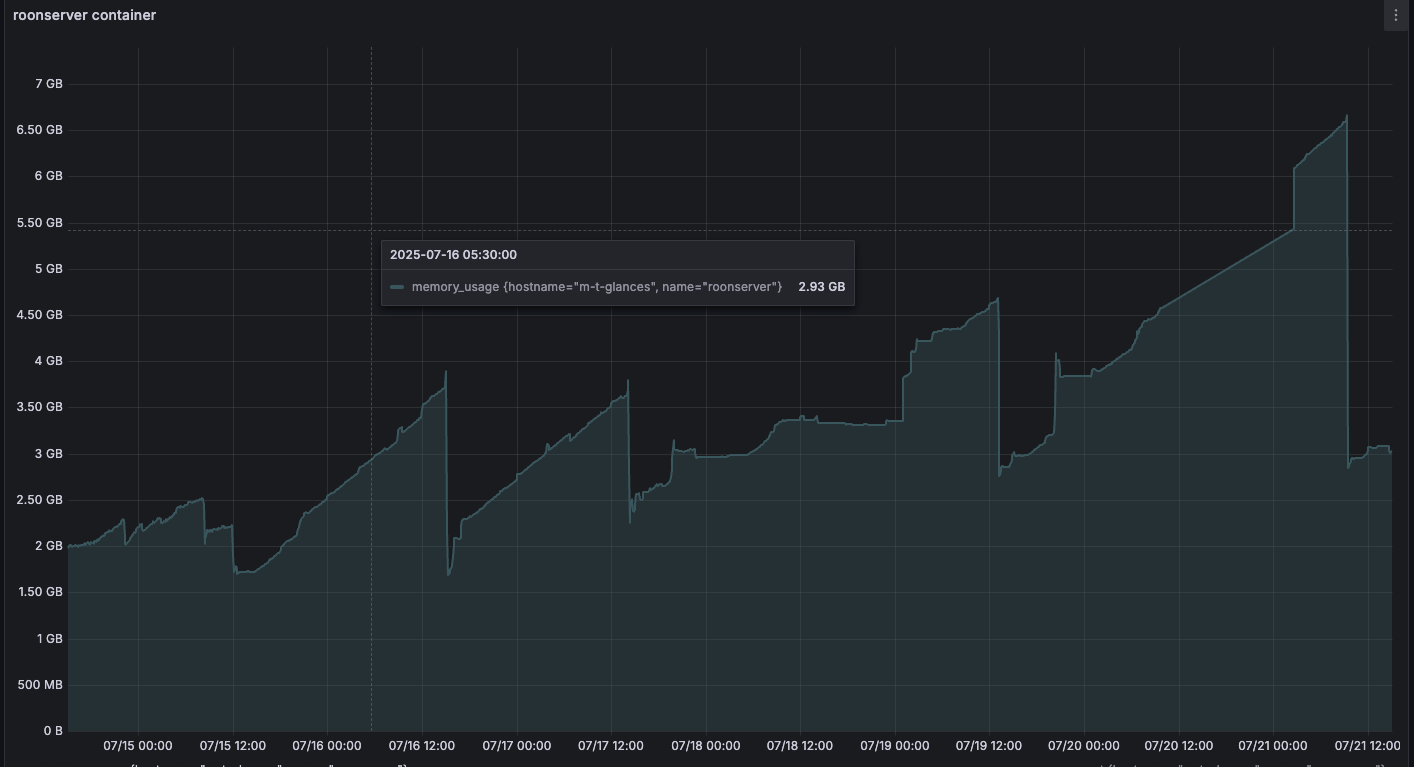
This means that in a C# program, you will always see some form of memory increase over time, then garbage collection. That’s the “sawtooth” profile that your picture illustrates.

This doesn’t mean that there aren’t memory leaks, but the pattern you show doesn’t illustrate memory leaks. A memory leak in a C# program can often show up as an increase in the low point in memory use over time. In other words, each time garbage collection happens, memory use drops. If, over time, the point that it drops to is clearly increasing, that can be a memory leak. Your picture doesn’t show that.

In my opinion, Roon’s memory usage and garbage collection are poorly tuned. Garbage collection happens far too infrequently and the consequence of this is that GC is longer running and more CPU intensive than I believe to be healthy. Because of how Roon has configured GC, this shouldn’t necessarily be problematic, but it can be.

You’ve tried adding more memory to help with the problem you’re seeing. That’s not going to help and may make this worse.

What I’m finding is that Roon runs well when it’s constrained to enough memory to accommodate the user’s database (LevelDB likes to live in RAM) and then some fixed headroom. I have a recommendation for an experiment.

Figure out how much memory Roon is using after it’s been running for 15 minutes and you’ve been playing music on the number of zones you typically play at the same time. Take that number and add about 1.5GB to it. Assign that much memory to your VM. Restart.

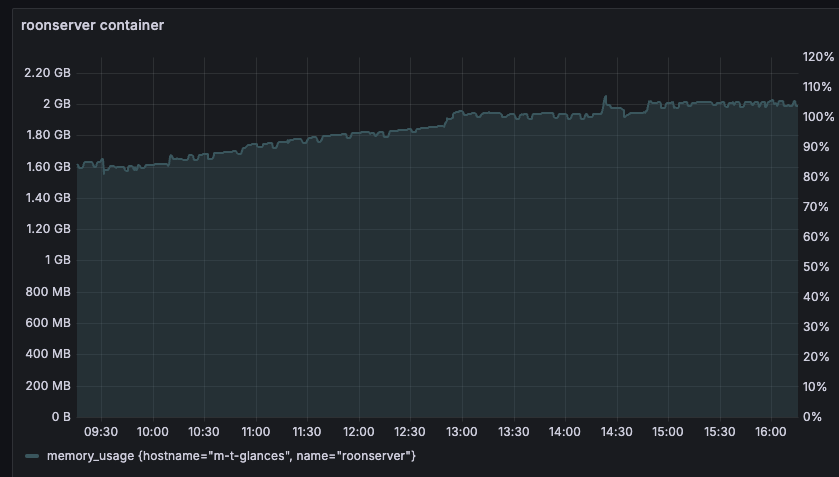
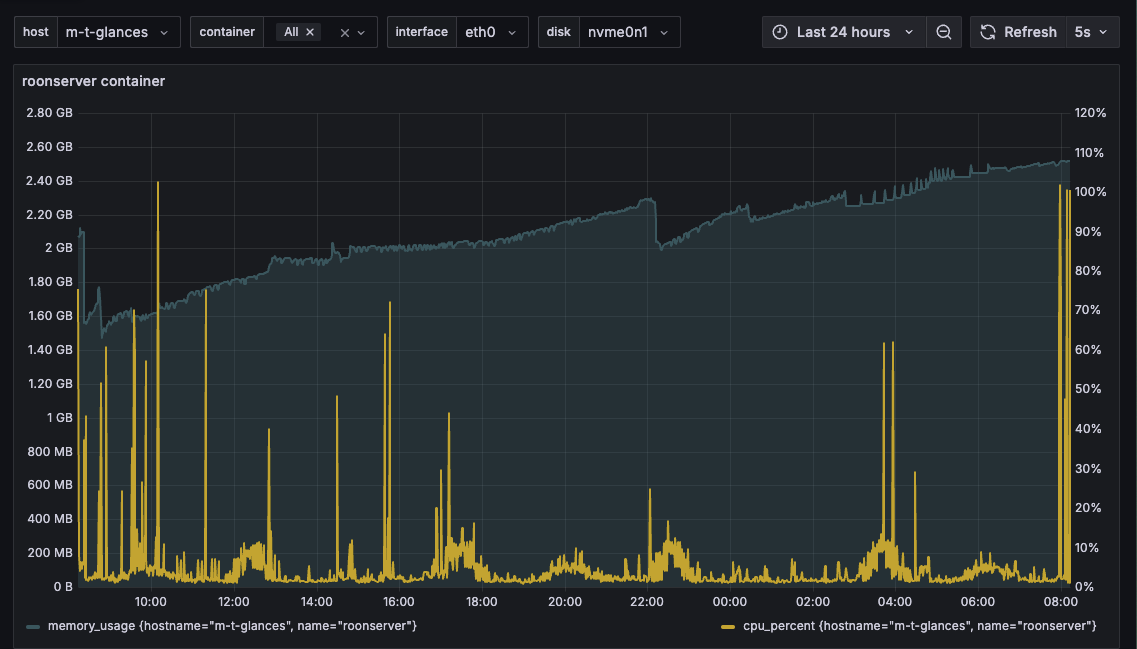
My guess is that you’ll see memory grow and drop in a way that still illustrates garbage collection but the garbage collections will be much more frequent, use much less CPU, and will be far less dramatic. I run Roon in a container. When I allow it to have a lot of memory, it looks like what you’re seeing. When I constrain it, it looks like this:

I’m very interested in learning what you see if you try this. I’m increasingly of the opinion that Roon really needs to do a deep dive on how they are configuring garbage collection.

Appreciate the response - but this is absolutely, without a doubt, a memory leak.

The pattern I show does indeed demonstrate a memory leak. The low point occurs when the service is restarted, freeing the memory. If I don’t restart the service, eventually the kernel will kill it as it goes OOM. Its a game of chicken. If I give this thing 10TB of memory and let it run, it will consume all of it over time. Guaranteed.

The sawtooth on the chart is not GC stepping in. It is me or the kernel stepping in.

If I reduce the amount of memory assigned to the VM, it will simply crash (OOM) sooner, or facilitate the need for me to restart the service sooner.

We also know that it is possible for memory leaks to occur in applications running inside the .NET runtime. Just last week, Roon advertised an update that fixed a memory leak. They just need to fix this one as well. :wink:

It never used to do this and I have been running this for over 3 years. A latest update has absolutely introduced a memory leak, Roon just needs to debug it.

I do agree though that there is something also wrong with the GC. It is possible Roon is tuning the GC outside of what the defaults are in the runtime, and it is causing it to run poorly. Or, most likely in this scenario, as it the case with Occam’s Razor, it is simply a memory leak.

Thanks very much for the tip, I will still try this and report back!

Looking forward to hearing what you see if you play with it like I suggested. I’ve been experimenting with this behavior for weeks - I use a stack with Glances feeding Influx and visualizing with Grafana. What I’m seeing is interesting.

I’m curious though - are you seeing it run out of memory and crash or are you proactively killing it before it does? If you’re killing, then please at least let it run its course so you can see if it GCs or crashes.

Just to show you I’m not nuts, here’s the same version of Roon running with more headroom. You may be right about there being a memory leak but I don’t think that’s the whole story.

Oh…one more note….when I overlay CPU utilization into the chart, things get really interesting with GC’s using 200%+ CPU (multiple cores) when the container is given unlimited memory whereas GC CPU is barely noticeable when memory is constrained since it’s the tiny, frequent GCs you see in my first image.

1 Like

I have had enough of it crashing with OOM halfway through playing music, so as a temp workaround I have set systemd to restart it when it hits a certain memory ceiling. I also get a Zabbix alert at a very similar time with high memory usage on the VM. The systemd restart also interrupts my music of course, but not all the time - as sometimes it restarts and I am asleep.

But absolutely you can watch on a chart the memory will increase all day long until something steps in, either the kernel OOM killer, or systemd. If the kernel gets to it before GC does, something is broken.

That’s awful. Sorry. I thought you might be seeing what I’m seeing but what you’re seeing is either unrelated or a worse manifestation of it.

I agree with you about VM but I don’t think anyone at Roon is going to be sympathetic.

1 Like

I’ve actually now replicated Roon running out of memory and dying.

I know that this will likely be ignored because it involves Docker. That’s too bad because whether or not Roon supports Docker, it’s a very effective lab for finding issues. I hope someone does care about what @scidoner reported at the start of this thread and what I’m adding here.

I’ve seen Roon grow memory usage over time. It got much worse with the May release. I’ve been monitoring and graphing it for months.

I started an experiment yesterday. I run Roon in a Docker container. I usually give that container a lot of memory headroom. This time, I gave it about 1GB above its baseline, which means I capped it at 2.5GB.

This image shows memory and CPU across time. For almost a full day, Roon behaved absolutely fine though you can see that it’s memory use was increasing. You can see many small garbage collections along the way. But memory use just increased inexorably. It just grows over time. If you give Roon enough memory, the garbage collections will get spaced out across many hours but when that happens, you can see the CPU go very high at GC time and the GCs predicatbly begin to take longer. I know that some people talk about how Roon’s performance starts to degrade if they let it run for days. I suspect it’s the GCs as memory use grows.

In my case, Roon ultimately managed to consume 100% of the memory in the container at which case it suddenly started having problems and ultimately became completely non functional. You can see at the far right that it’s at 2.5GB, which is 100% memory utilization in the container and you can also see how the CPU is spiking repeatedly as it crashes and restarts.

Running at 2.5GB versus more RAM isn’t causing this problem, it’s just speeding up the impending doom to, in my case, about 24 hours. This is some combination of memory leaks and garbage collection policy issues. I know this is Docker but it has to be happening to everyone in one for or another. I wish someone would take the time to look at it.

2 Likes

Yep, this is precisely the behaviour I am seeing. May does seem about right you know - it definitely was not like this when I first started using Roon, and it has definitely gotten worse very recently.

Appreciate the time taken to reproduce this. There is definitely a leak somewhere, possibly in unmanaged code, and this could be creating memory pressure as well for the GC on the managed side. Without a doubt though, we do not want long lapses between GC as you say - the CPU time for this is far too costly for something that needs to almost realtime process audio.

Containerisation is a marvellous way for the Roon devs to reproduce, debug and fix these issues.

1 Like

Hi, @mjw.

Are you sure you don’t see some form of this? Here’s another image of what I’m seeing. This is measuring memory utilization of the container, but I can see that it’s the Roon Appliance process consuming the memory. Roon is the only thing running in the container.

I’ve had offline discussions with others who are seeing similar memory issues on more supported topologies (e.g., DietPi and Synology, though we’re a little less confident about the Synology issues).

I don’t think it’s Docker that is causing this but it’s very possible that it’s related to some usage scenario. For example, I use the Home Assistant extension and I cast to a couple of Chromecast devices.

Is your Podman-based memory just completely flat over time? I’ve been tracking Roon memory usage since 2024 and it’s pretty clear to me that something changed in the May release to introduce or exacerbate these issues.

In this image, you can see that the process starts off using less that 2GB. Over time it grows and drops with collections and then there’s a strange period where it appears to plateau. Then it grows again.

Any thoughts?

1 Like

Seeing similar behavior here now too. This wasn’t an issue until sometime in the last few months. Will check my telemetry to see if I can corroborate May.

1 Like

I can’t say for sure, as I’ve had frequent reboots recently while introducing changes to my server. However, I will monitor now.

2 Likes

For the past 48 hours, my container has been stable at around 1.8 GB memory utilization.

@gTunes, how are you producing the chart? I can stream stats, but not particularly human-friendly, and I would rather not mess around converting JSON into something I can use in a spreadsheet.

@mjw I am using Zabbix, and @gTunes a combination of Grafana, InfluxDB and Glances.

These are my container charts since deployment a couple of days ago. I switched to running Roon containerised.

The charts are still showing some leaky type memory allocations, plus what appears to be a massive GC accompanied with CPU spike (due to GC).

@gTunes is definitely on the money with some issues with GC. When the GC runs, music stops for a brief second or two.

The underlying VM is granted 6GB of memory, and the container has no upper limit. I will see what this does over the next few days, before capping the container memory limit.

1 Like

I’m doing what @scidoner already described - a stack composed of Glances, InfluxDB2, and Grafana. It’s not a particularly easy thing to get stood up.

There’s now another thread in which it sounds like the dev team is working on one or more memory leaks. I hope they’re also looking at GC issues. What I see is indicative of the kinds of problems long-running processes can have with poorly tuned GC. It very may be a combination of memory leaks and GC tuning (including interactions between the two) that are causing these issues.

When I say “memory leak” what I mean is the traditional meaning of the term in which memory is allocated but never released. This can be the managed scenario in which a reference is unintentionally maintained (typically in some global collection like a hashmap or vector) or some native memory (e.g., memory used in an interop scenario) isn’t freed. I’m differentiating that from memory that the garbage collector is capabable of reclaiming but isn’t being able to do so because of policy or something else causing it to run infrequently (at least for gen 2 and LOH).

2 Likes

Something to go on my longish list of winter projects.

1 Like

When you get to it, please don’t hesitate to ask for help :slight_smile:

The guy that writes Glances published instructions including a compose file and a Grafana template. He hasn’t kept it up to date and I recall having to fix issues in Influx and in Grafana. Once you have it up, though, it works very well.

Here’s my latest. I’ve hidden the CPU utilization, this is just memory. I’ve confirmed in the Roon logs that the massive drop towards the right was a GC and not a process restart. This is not what a healthy process should look like

2 Likes