After a few hours and playing music with Roon from a local FLAC album, I can advise that the issue of memory leak, with the variables in place is worse.
I think you got this right already, but I want to try to answer anyway.
When making changes using /etc/environment, you’ll need to reboot, then attempt to use Roon “normally”, and see if physical memory usage seems to grow to consume all available memory on the machine.
Hi @ben, during the last three days I was unfortunately cut off from Internet and suffered intermittent blackouts. These problems seem to have been addressed, and since yesterday afternoon all is back to normal again…
So I unset the previous environment variable DOTNET_GCRetainVM and set the new suggestion DOTNET_gcServer=0, rebooted and started to ‘stress’ Roon by playing back, adding new Qobuz favorites to my library and removing Tidal favorites.
I have been running now for 18 hours, and these are my observations so far:
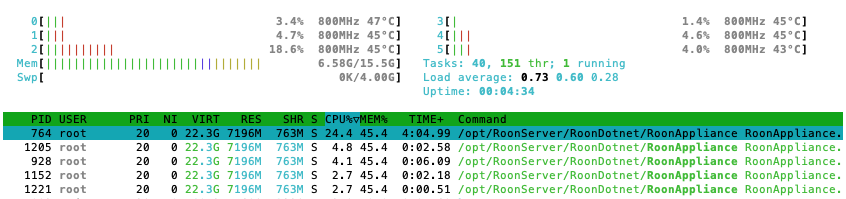
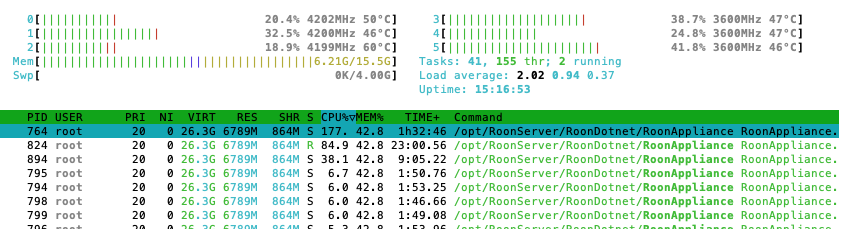
After startup, the system stabilizes initially with RES memory size 7200M.
After adding/deleting a few albums some time later, the Tidal/Qobuz storage library update process is triggered, RES memory size goes up.
During this process, two aspects were changed: First, the reported load grew up to and slightly over 2.0, when before it stayed around or slightly above 1.0. But, and quite unexpectedly, user interaction on my two remotes (Android Phone and iMac) stayed seemingly unaffected. Noticed some little resistance with scrolling, but page loads and interaction with buttons (start/stop play etc.) felt snappy.
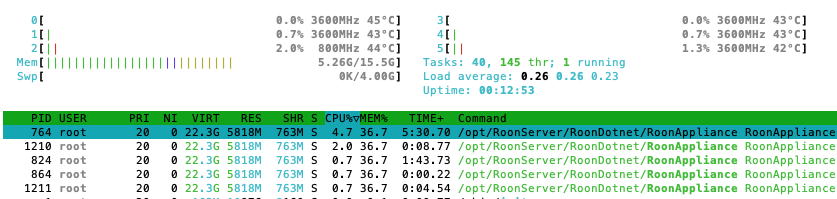
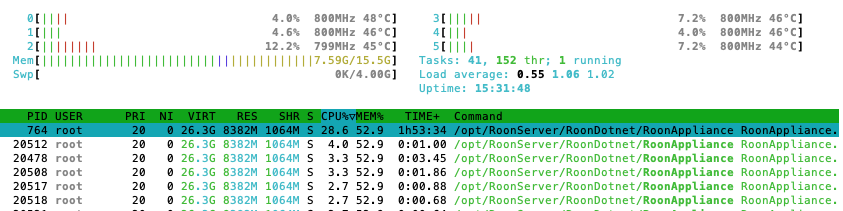
I listened to music until late at night, then the system stayed idle and performed the daily database backup an 3 AM. Here the screenshot first thing this morning; RES memory size has dropped again:
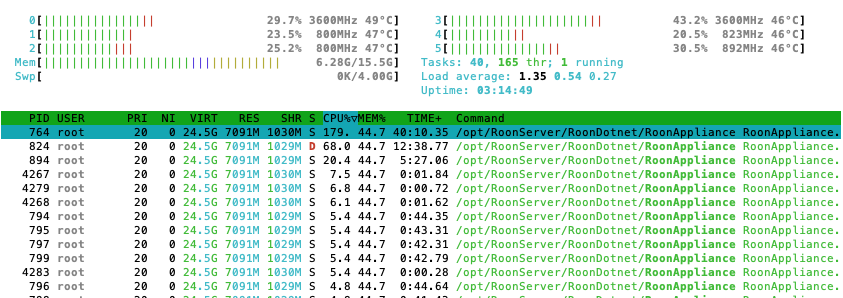
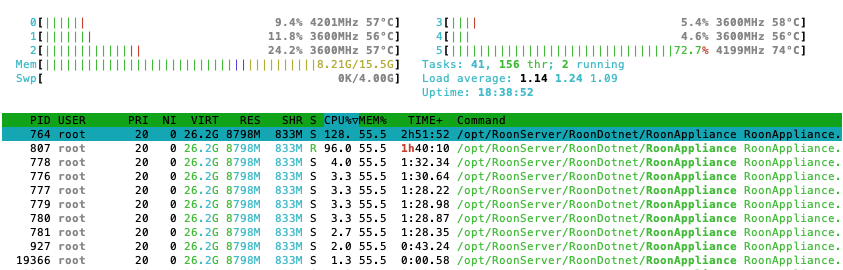
As it is release Friday, I took advantage and added some more new albums (Qobuz). The Qobuz storage library update process was triggered again and you can see how load is around 2.0. RES memory during this process goes up:
The storage update process ran very fast and at the end the reported RES memory size was about 8400M. Now, about three hours later and after having added some more albums, the memory size stays the same.
So, my first impression with this recent change is positive. I don’t observe any short-term memory usage increases other than during the storage library updates. Even so, the user interface interaction this time stayed snappy. If the system keeps performing like this even after several days of runtime, I’d say all is well!
I hope my Internet access and power stay online during the next days, so I can keep testing the performance and memory usage during the following days. I’ll report back after the weekend.
This looks good to me too. Thanks for the help, I really appreciate the detailed reports and being able to do something to test this without waiting for a full release cycle.
I’d really appreciate it, thank you
Hopefully this will let us resolve this for all RoonServer users soon.
First… regrettably, last Friday afternoon I had another environmental event which forced my Roon server to shut off. Since then it has been running, though, and I am nearing the 72 hours mark:
After playing music Friday night, on Saturday morning the reported RES memory size had dropped, as it does after running the database backup at 3 AM…
Again, after adding a couple of albums to the library, the Qobuz storage library update process was triggered, and the RES memory size immediately went up:
During the rest of Saturday and after finalizing the storage library update process, metadata updates kicked in, and that process is also very demanding on memory. It ran for several hours. This is from 3:10 pm:
Sunday morning, the reported physical memory size had again dropped. See here log excerpts shortly before and after the 3 AM database backup. The metadata update process of the previous day had made the reported file handles go sharply up, and they also stayed up until the database backup process:
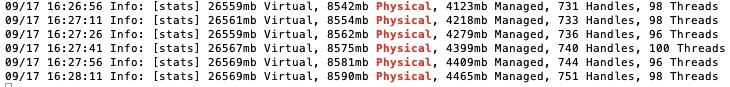
Yesterday afternoon, once again a metadata update process was triggered at approx. 16:12 pm. See the immediate effect on physical memory usage and file handles:
The process terminated in less than 14 minutes, and afterwards the physical memory size and reported file handles stayed up for the rest of the afternoon and the night:
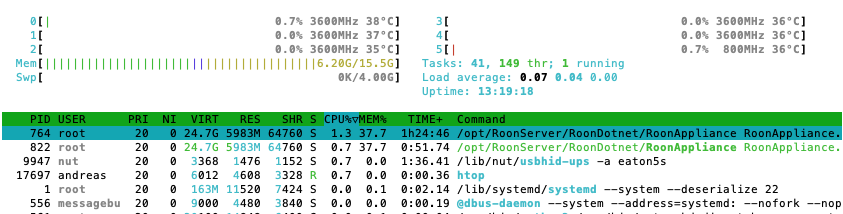
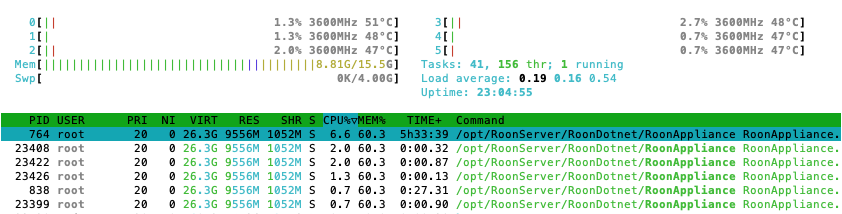
You’ll notice that the physical memory size doesn’t go back to the approx. 5900M of the day before… At this moment, after playing some albums this morning and without any metadata updates nor storage library updates today, it sits at about 6200M, with a tendency to decrease little by little.
Observations:
At no moment the music playing was affected by the running processes. The user interface remained reasonably snappy.
The garbage collector seems to behave better with DOTNET_gcServer=0. I could observe little increases in memory usage during music playback and perusing the user interface, but memory would come down after some minutes.
I have never experienced sudden increases in physical memory usage, other than by the storage library update and metadata update processes. Problem is, in my experience this is never brought down again by other means than performing a database backup. And this only during the first few days after server startup. After that, the reported physical memory usage stays high, and performance of the server will worsen, until a restart is necessary.
During these 72 hours, the max reported physical memory usage was about 10.200M during metadata update.
I don’t think that tuning the GC behavior alone will resolve the widely reported performance problems for users with larger databases. It doesn’t seem right that the storage library update and metadata update processes would make physical memory usage go sharply up, without ever releasing that memory after the process terminates. For a long time I have been observing that a database backup will bring physical memory and file handle numbers down, but only for the first two or three days after server startup. After that, not anymore. This effect will not be noticed with smaller databases, say <70.000 tracks or something around that. With a database growing above that size, the performance impact by storage library update and metadata update processes will be felt ever more.
I’ll keep observing the server behavior and report back with any observations in a couple of days.
I think I generally agree with what you’re saying here. I’m hoping that this setting change will reduce the tendency for physical memory to not decrease when managed memory decreases, so that there will be less of a “ratchet” effect where physical memory usage only ever increases.
I agree, so I’ll keep working on other fixes in addition to this sort of change. I’m glad this seems like an improvement, regardless of how much work we may still have to do
Roon has been playing music for several hours, and compare this recent log with that of 03:05 am, after the last database backup!
Do you have an understanding why the storage library update processes for Qobuz and Tidal would be executed ever more slowly, after several days of server uptime?
I can estimate the rate at which these processes run by the rate of new entries written to the log file, and I’d say that on a newly started server, the process runs at least two orders of magnitude faster than the same process after some days of server uptime…
Having worked on memory managers and GC for a significant (past) part of my career, there are many ways for subtle issues (such as certain kinds of fragmentation due to the interaction between an application’s memory manager and a library chunk allocator) to cause allocation time to grown with number of allocations.
Well, whatever the subtle underpinnings of these allocation processes, of which I know nothing, the observed performance impact is massive. It is that which at good last forces the user to restart Roon server, as every process and user interaction feels like swimming in molasses…
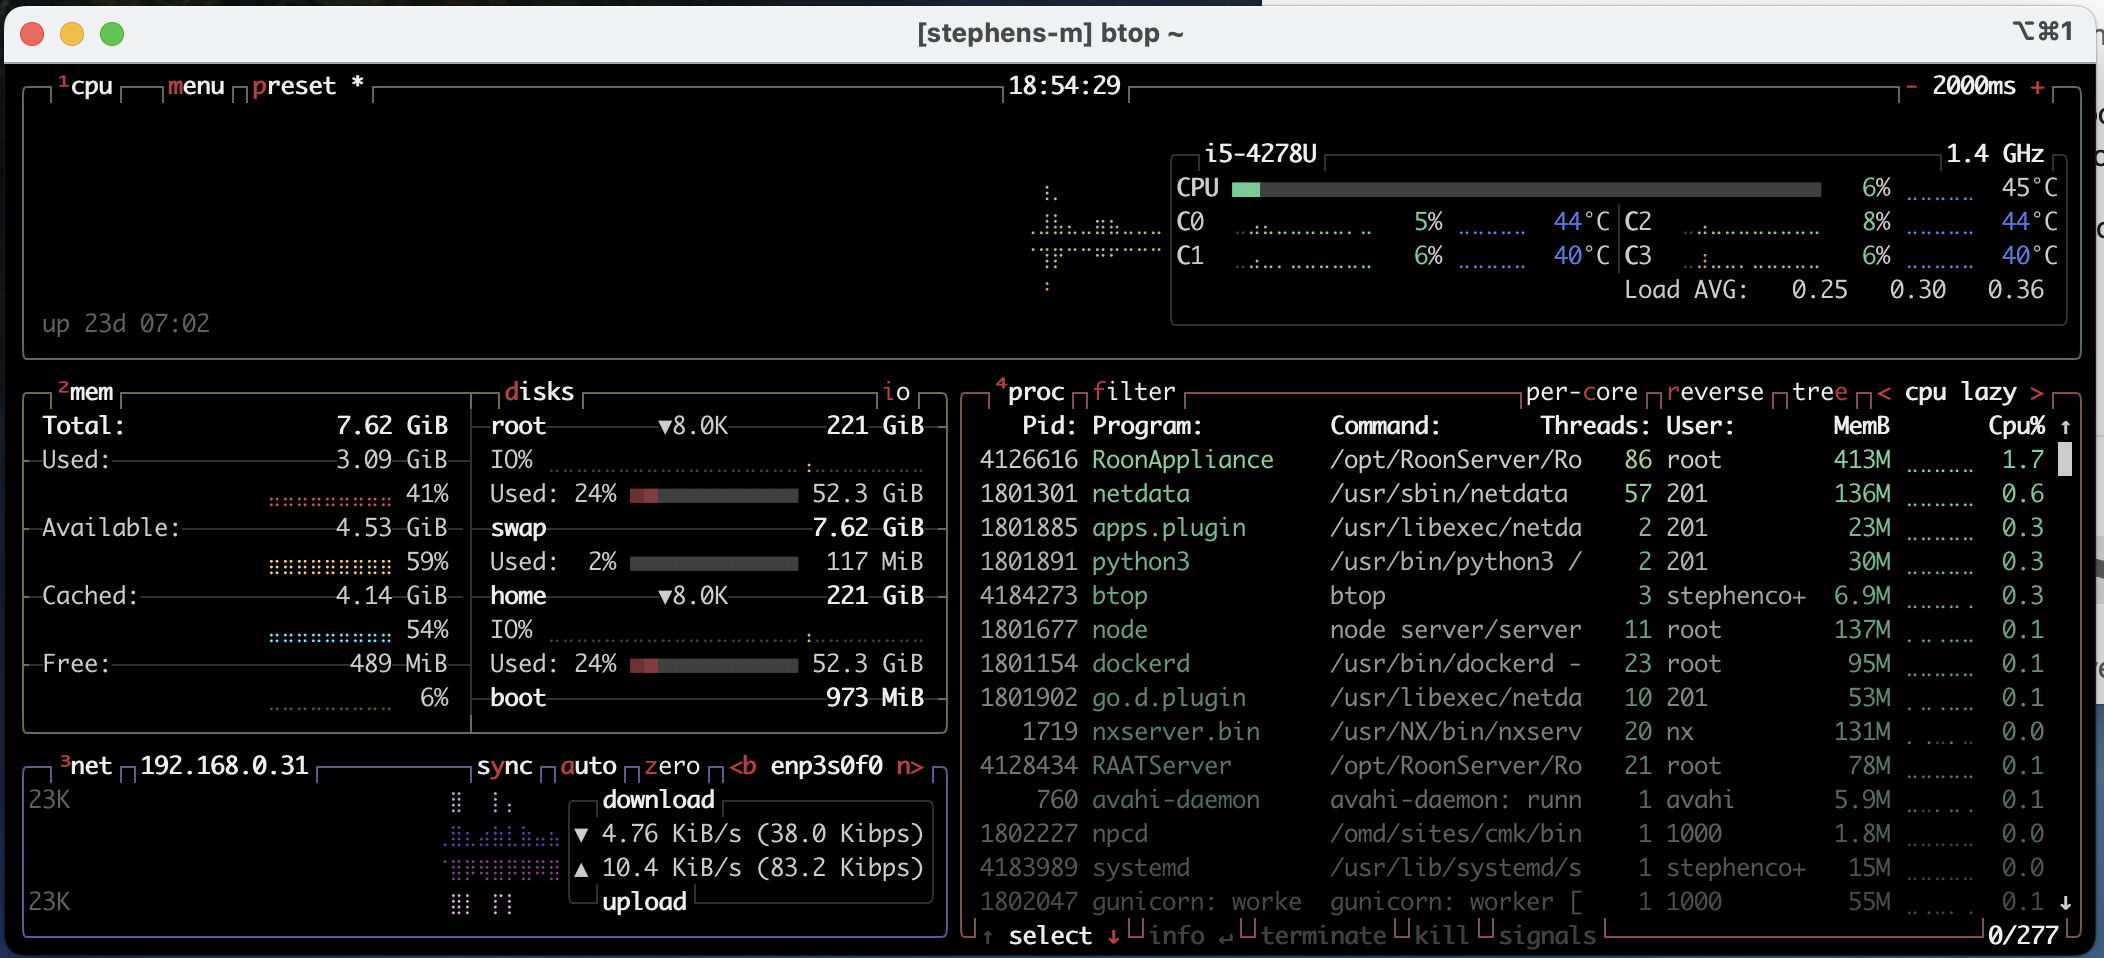
Unfortunately this does not solve the memory leak. I was using Roon normally this afternoon while writing a document. Thats the memory spike at the end of the graph. If I had kept going it would have consume all 32GB RAM and then the swap space until that was consumed also.