Song loudness by genre (graph)

Interesting graph that contribute to the dynamic range discussion.

Source: https://www.reddit.com/r/dataisbeautiful/comments/e4xk6q/music_loudness_by_genre_oc/

I guess the data source is http://dr.loudness-war.info which contains CD, vinyl and download. Some downloads are 24 bit, but not sure how many.

1 Like

I will have to check this out further. Thanks for sharing!

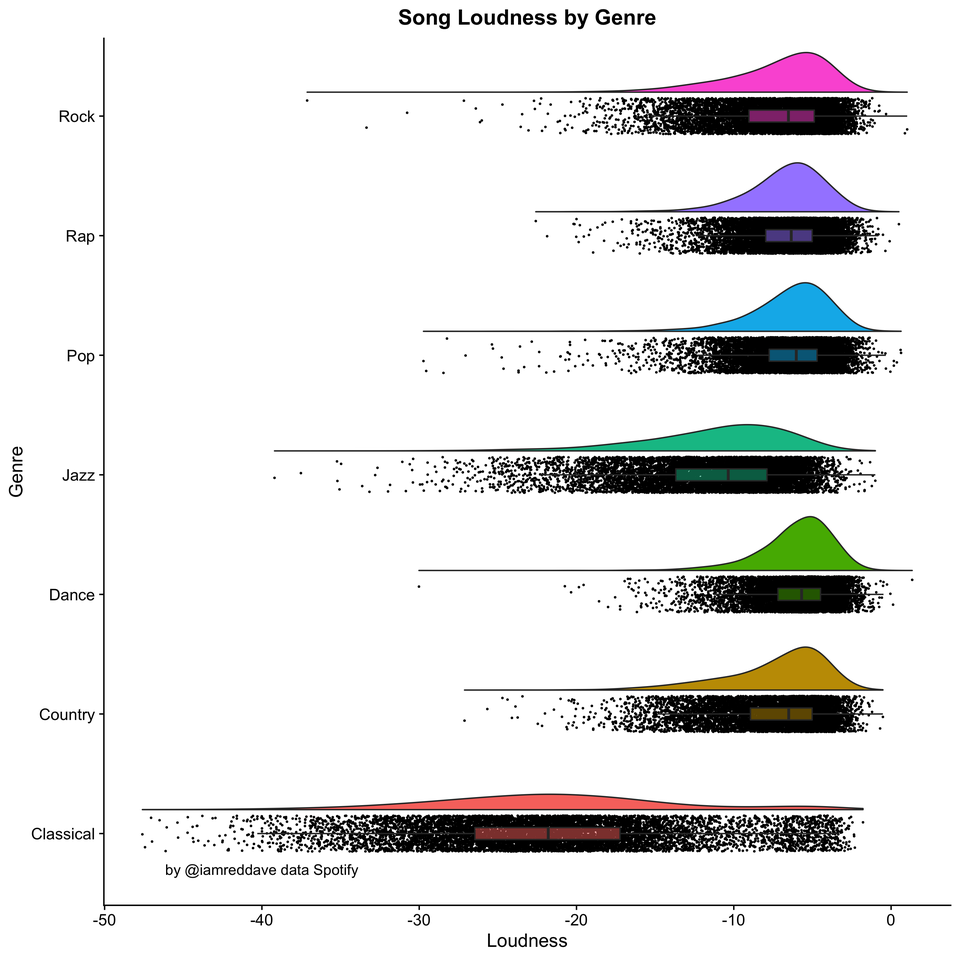
It’s an interesting chart and the loudness wars have not clearly not been good for music.

However, I have a non-loudness war observation: Unless you have a listening room with a low noise floor and in which you can listen at concert hall levels, classical music can IMO be unlistenable unless it is dynamically compressed* during replay…

* “dynamically compressed” includes continuously adjusting the volume with the remote so you can hear the quiet bits, whilst responding quickly to huge volume changes to avoid provoking the ire of the family, neighbours, etc…

1 Like

Same graph by producer would be pretty interesting.

Neighbours love to hear all of my music…I believe…

1 Like

Scales for both the x and the y axis might be just a bit useful since without them what are we actually looking at.

RMS level (-dBFS). Thirty years ago, a typical pop/rock digital mastering RMS level was -14 dBFS. Now, it is more like -7 dBFS.

AJ

Y axis is not a scale, just groupings of data points.

I find this the case in the car, but in my living room, it is less of an issue for me. I may need to turn it down a bit during crescendos and/or up a bit during quieter parts, but not unlistenable.