Why "Lost is not Lost"

On Holo Spring 3 DAC, with AHM7EC8B modulator, the output noise falls below the DAC’s analog noise floor by 1 MHz. Within that 1 MHz range the noise is totally uncorrelated, be it AHM7EC8B or for example ASDM7EC-fast.

If you run a 0-22.05k sweep, sampled at 44.1k through a NOS R2R DAC, your output looks like this:

And same sweep, but sampled at 705.6k through another R2R it looks something like this:


In this latter case there’s practically no reconstruction filter after the conversion stage, so the spectrum goes well beyond 5 MHz and ends up aliasing back down on the analyzer’s 10 MHz sampling rate, as you can see. You can count that the spectrum goes up to about 12 MHz.

So you can see that PCM or multi-bit in general is all but free from correlated ultrasonic output. You will have a huge spread of 100% correlated ultrasonic images.

And here are some examples of images from a multi-bit delta-sigma DAC output:


Same sweep. 100 MHz measurement bandwidth.

What? DSD1024 has a Nyquist bandwidth of 44.1kHz x 1024 / 2 = 22.58MHz. 5.6MHz corresponds to DSD256. My graphs don’t show anything beyond Nyquist bandwidth.

They are, because they’re present for every input signal, even zero.

With multibit, you don’t get any images, just 100% random noise all the way up to Nyquist limit, which again, for DSD1024, is 22.58MHz.

I already showed you that for 4 bits, that’s not the case, provided that you use full TPDF.

You don’t seem to understand how Shannon/Nyquist works.

Once again, my example stops at fs/2. DSD1024 has a fs of 44.1kHz x 1024 = 45.16MHz. That’s why it’s called DSD1024. Your own HQP agrees with me:

image

Since you’re flunking basic concepts of sampling, you’re reaching the wrong conclusion.

Yes, they do. Since this is not Nyquist sampled data, it is oversampled. Now it is much higher up, compared for example to AKM chips where you have images around every multiple of 352.8k for 44.1k rate family, and around every multiple of 384k for 48k rate family.

Then they are obviously not correlated, are they? Maybe they are something else, totally uncorrelated?

Yes you do, around every multiple of the sampling rate.

So in your example case output rate was DSD64? So your 1 kHz tone will appear at 2821.4 kHz, 2823.4 kHz, 5643.8 kHz, 5645.8 kHz, and so on and so on.

You did not show the spectra for example over 8x the sampling rate.

Quite the contrary, you don’t seem to understand. See here:

Yes, but oversampled data. This is how spectrum of stereo 1 kHz tone looks like, sampled at 44.1 kHz 32-bit TPDF dithered, when you look at it at 8x bandwidth:

Here’s a mono sweep 0 - 22.05 kHz, sampled at 44.1 kHz. TPDF dithered to 32-bit resolution, at 352.8k rate 8x bandwidth:

No, that’s what you are doing.

Now you have some more thinking to do if you want to understand what you are looking at. But the modulator HF output is totally uncorrelated and fully dithered.

Works very very well on discrete converters despite the high rate. And no ESS-style IMD humps:

Gives also very nice multitone performance:

As mentioned earlier here, the data needs to be reconstructed through a low-pass filter as part of D/A conversion for correct result, to avoid high frequency images, as described here:

What do you mean by “not Nyquist sampled”? Every digital signal is sampled and thus has a Nyquist limit strictly related to the sampling rate. Whether it’s natively sampled at that frequency or oversampled, or whether it’s represented by two or more levels, is not relevant. Oversampling is applied specifically to be able to extend the Nyquist range and populate it with unwanted DSP products - namely, that result from bit reduction - so it is very much a Nyquist range.

Regardless, where does the 5.6MHz figure come from in the context of DSD1024 anyway?

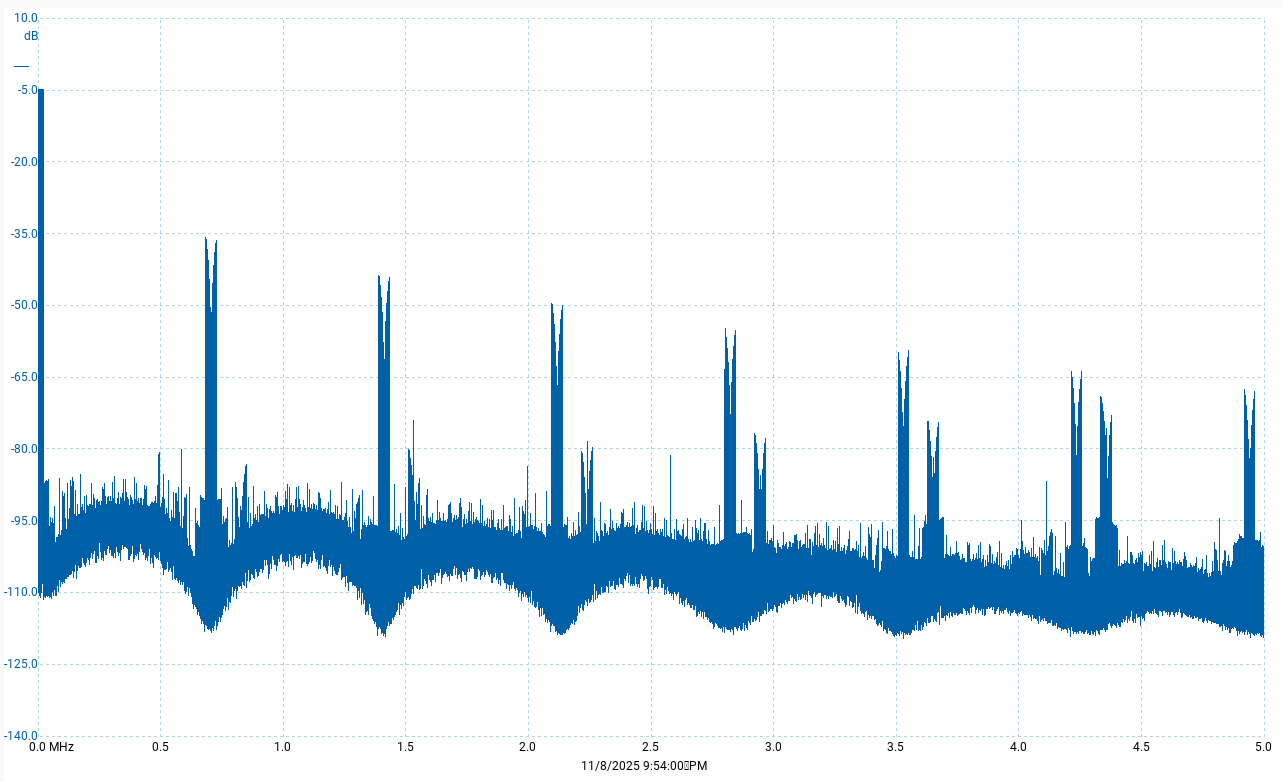
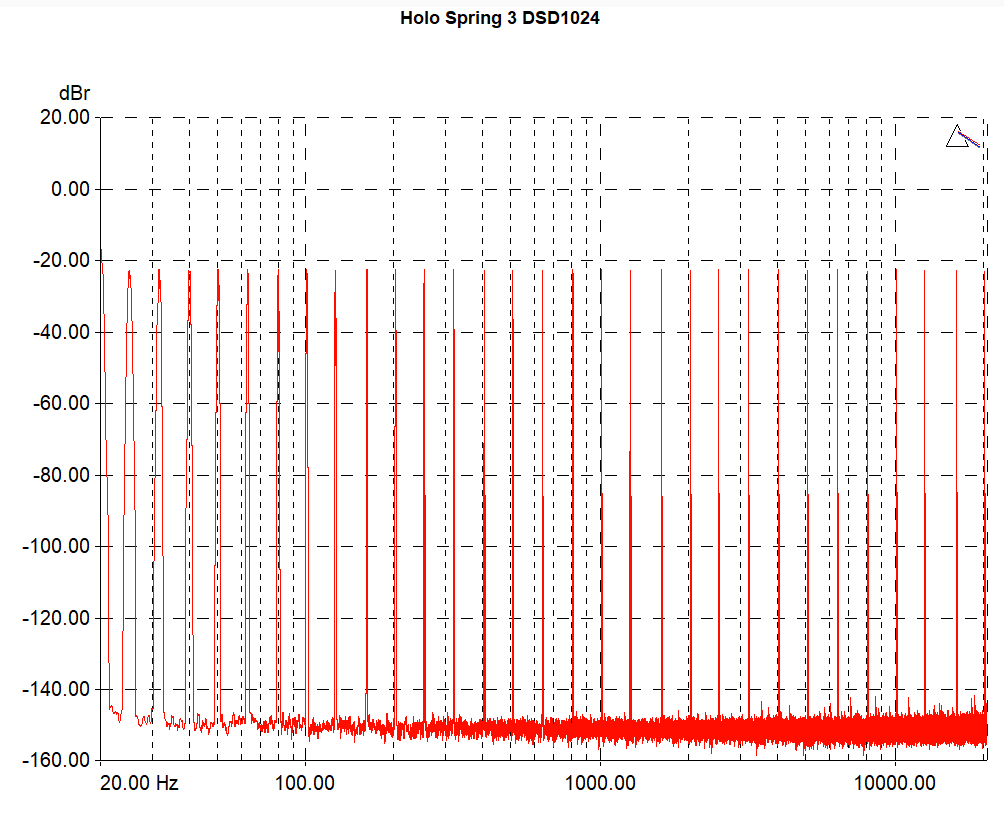
There’s no maybe, they are idle tones within fs/2, so that excludes periodic images. By definition, idle tones are solely the products of DSP and unrelated to the signal. You disagreed with the term “idle tone” and I responded. I did not say those were correlated; the other two frequencies I showed in the second graph are the ones correlated with the signal.

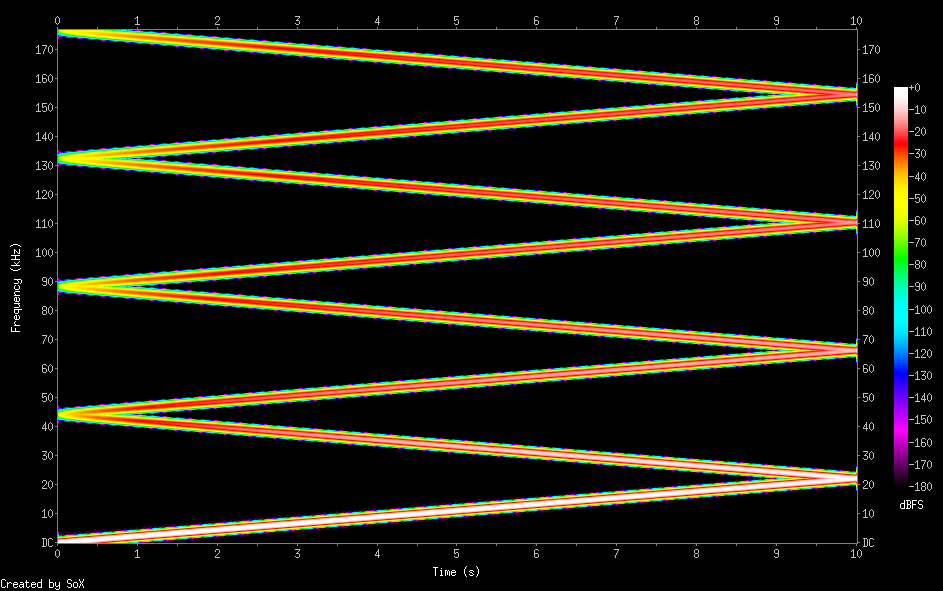
Why would I show an 8x bandwidth when the signal can’t carry anything over fs/2? Obviously, any extension beyond that is periodic and thus redundant.

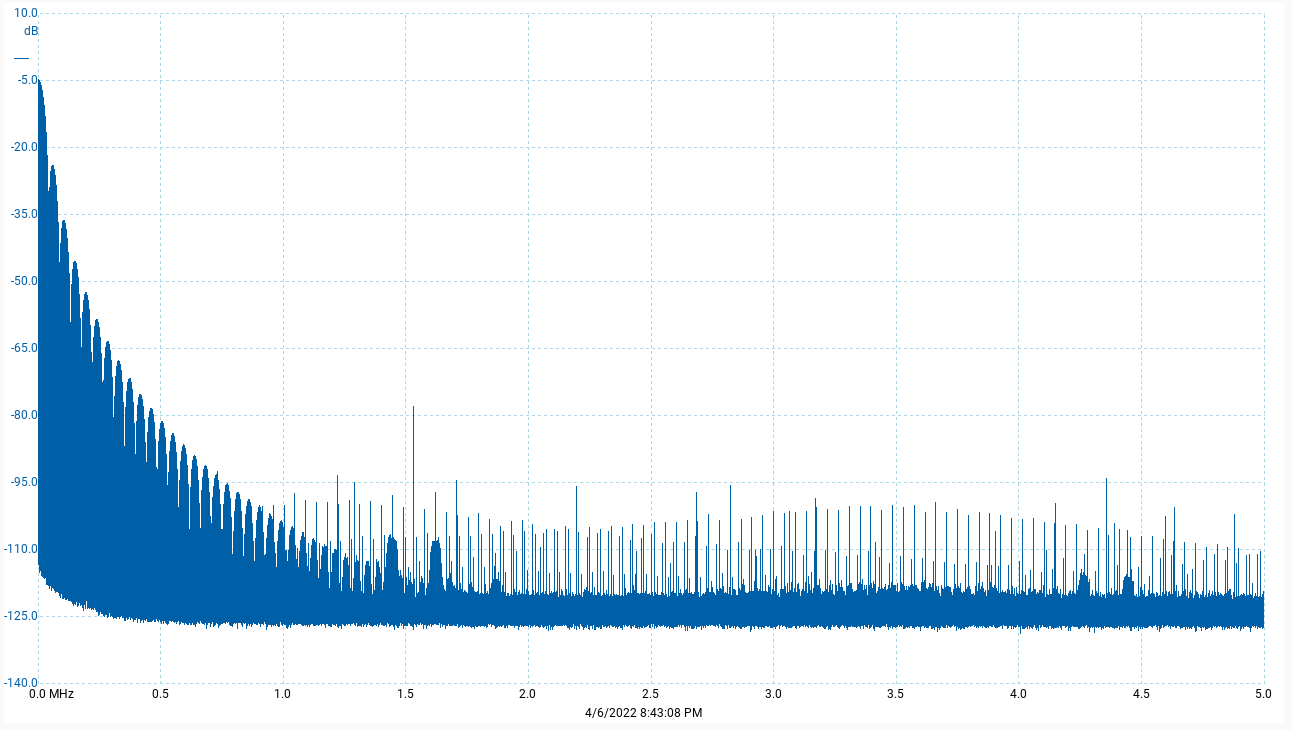
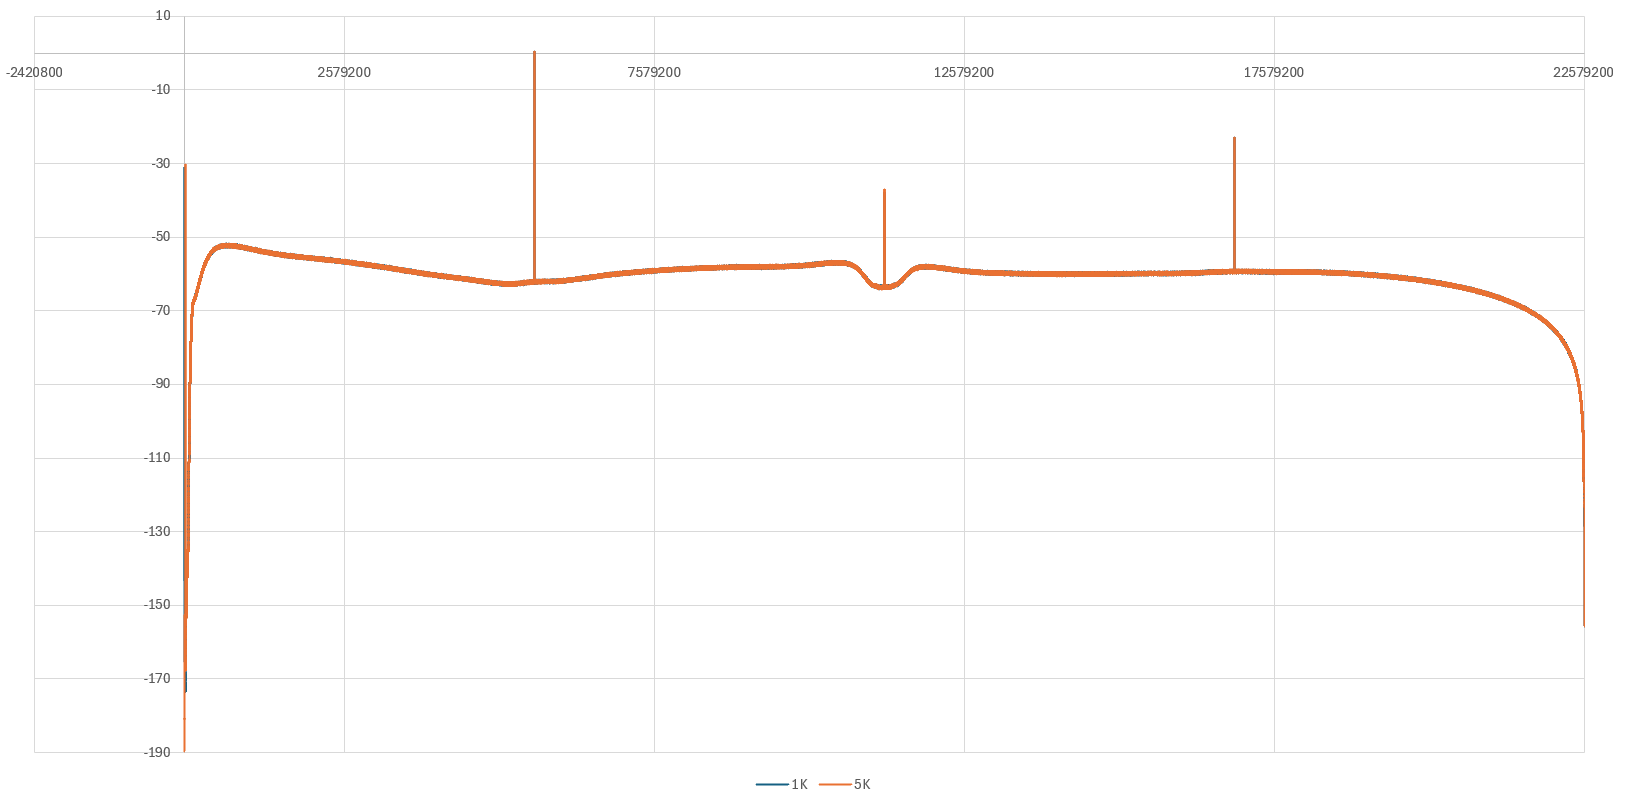
Once again, my graphs don’t show anything over fs/2, so there’s no redundancy there and thus should contain no periodic images. To make that clear, this is the full spectrum again - linear this time - with the upper axis limit set exactly to 22,579,200Hz, i.e. fs/2, a.k.a. the Nyquist limit, for DSD1024:

It’s clear the two idle tones are not periodic images, since one is smaller than the other.

And as I mentioned earlier, that’s irrelevant for my point, since quantization noise is a digital concept and shows in the digital signal. Should it be filtered out during D/A conversion? Yes. Will it be audible? Most probably not. But correlation will always be present in the digital domain when you only have two levels, and it’s going to be present throughout the whole spectrum; noise shaping doesn’t move noise from one place to another, it just shapes it, so if it’s present in some regions, it’s also going to be present in the audible range to some extent.

@Marian @jussi_laako you two should go somewhere for a few beers together and thrash all this out.

Exactly that. You are making over-simplified assumptions here.

Because you are trying to forget that there are fs x 2, fs x 3, fs x 4 bands. I have shown you couple of examples in my previous post.

Yes, and looks axactly as it should. And it has completely no modulator produced idle tones, spurious tones or things correlated with the input data that would originate from the modulator or quantization in general. All noise is totally random although frequency shaped.

You just don’t understand your own data. And there’s a limit how much I’m going to explain it to you. I’m sure you’d very much like that I’d spill all the beans of work I’ve done over past three decades.

As you can see from your own analysis, that is not the case here.

Well, it does, but that’s besides the point here… The left-over noise in what ever comes out of the D/A stage is essentially similar to running this text through AES encryption.

But this way I can read it and learn something

5 Likes

I’m not forgetting that, I’m just not including anything about fs/2 because it’ll be periodic and will show exactly the same data. I never saw any FFT analysis of real (i.e. non-complex) signals that extended outside [0, fs/2) range, other than for illustrating the periodic nature of it.

For DSD1024, there’s no periodicity below 22,579,200Hz, and you can see that nothing repeats identically in my spectrum, as you claim. And since you still haven’t answered my question about why you take 5.6MHz to be the Nyquist limit for DSD1024, my best guess is that you are trying to forget what’s going on above it, where the idle- and signal-correlated-tones are found. Or maybe it’s just a mirrored and low-pass-filtered DSD256 signal masquerading as DSD1024.

No, it doesn’t, it just passes the quantization noise through a transfer function, and, just like a transfer function, it cannot “move” frequencies around, it can only scale them.

I’m not trying to steal any proprietary knowledge here; I have no use for that. The basic principles of digital audio, which is what this comes down to, have been established long before that; there’s nothing to spill. You’re redefining the concepts to make the results look good, but the math doesn’t change and doesn’t lie. You can’t make a plane fly by redefining gravity.

1 Like

Can the thread be renamed?

“The Jussi Laako & Marian Show”

:wink:

3 Likes

Yes you both are and you are not, at the same time. :grinning_face_with_smiling_eyes:

Yes, exactly as I said. Don’t also forget that mathematically there are images also around negative frequencies as also shown on the Wikipedia page. So you also have images around -fs etc.

Well, this hopefully goes a little beyond the basics. Maybe some day you will understand, or may you never will.

Um, ok. And 1kHz is 1,000 cycles per second. Really important not to forget that either.

1 Like

I had a lovely Chinese takeaway tonight.

6 Likes

Yes, and you can have more than one 1 kHz tone simultaneously!

In order to recreate the analogue signal from PCM the digital stream goes though a filter. This filtering connects the data points but in order to avoid creating artifacts that are multiples of the sampling frequency the filter needs to be very sharp, e.g. for CD the filter starts at 22.1khz and must ensure no content above 44.2 to avoid creating artifacts. By upsampling the sample rate to 96Khz the filters to recreate the analogue can be less steep e.g. start at 48Khz and no content above 96Khz. Steep filters also create time domain distortion (pre and post ringing) so less Streep filters at higher sample rates (upsampled) means less time domain distortion, which is why higher sample rates sound better. It’s not because you can hear above 20Khz its because the filters create less time domain distortion which you can hear.

1 Like

It’s actually between about 20kHz and 22.05kHz, so it’s even tighter, but still very achievable in the digital domain.

You mean between about 20kHz and 48kHz.

But since the ringing is above 20kHz, it’s not audible.

Whilst you have the basic principle correct and, if the numbers presented are ignored, the point is sound, the detail of your post is incorrect.

For Redbook CD with no upsampling, the analogue reconstruction filter will have to pass frequencies up to an agreed upper hearing limit - say 20kHz but sometimes lower cutoffs have been used - and it must reject all frequencies above the Nyquist limit of half the sampling rate which is 22.05kHz. Upsampling to even 88.2kHz allows the use of a filter that still passes 20kHz but is in the stop band by the upsample Nyquist frequency which is 44.1kHz.

To put it in perspective, the filter required without up sampling has to go from passing to cutoff in a frequency range which corresponds to slightly less than a semi-tone (assuming a 20kHz cutoff) in the western musical scale whereas upsampling to 88.2kHz allows the used of a filter that takes over an octave to go from pass band to stop band. In the analogue domain, the non-upsampled filter is challenging and (relatively) expensive. The filter required for the upsampled case is much easier to design and cheaper to implement.

This is not true. When you mix multiple 1kHz tones, you get one of two results:

  1. A single 1kHz tone
  2. Silence (much less likely with random phase and amplitude relationships)

For example, with two tones at the same frequency being mixed, if the amplitude is exactly the same and the phase relationship is exactly 180 degrees (π radians) then the result of mixing will be silence. With any other amplitude and phase relationship mixing will result in a single tone.

2 Likes

You can have one on the left channel and one on the right :slight_smile: But it’s obviously another deflection, to steer the conversation away from an inconvenient subject, just like the periodicity of a digital spectrum.

1 Like

“A strange game. The only winning move is not to play. How about a nice game of chess?”

If everyone thought so, we would still live in caves