What’s happening? · I'm having trouble connecting to Roon
What type of connection issue? · Something else
How can we help? · None of the above
Other options · Other
Describe the issue Getting lots of timeouts for requests to https://api.roonlabs.net/ . It seems that 104.20.47.62 is down (not responding to pings). The other IP addresses (172.66.148.147, 2606:4700:10::6814:2f3e and 2606:4700:10::ac42:9493) seem to be up. So Roon is not completely unusable (just mostly unusable).
Describe your network setup Roonserver is on a hard-wired Ethernet connection. Router is a NetGear Orbi. Cable Internet service from Spectrum.
Suedkiez
August 24, 2025, 6:57pm
2
Jacques_Distler:
104.20.47.62
ping 104.20.47.62
$ ping 104.20.47.62
PING 104.20.47.62 (104.20.47.62) 56(84) bytes of data.
^C
--- 104.20.47.62 ping statistics ---
16 packets transmitted, 0 received, 100% packet loss, time 15359ms

$ ping 172.66.148.147
PING 172.66.148.147 (172.66.148.147) 56(84) bytes of data.
64 bytes from 172.66.148.147: icmp_seq=1 ttl=55 time=16.1 ms
64 bytes from 172.66.148.147: icmp_seq=2 ttl=55 time=18.7 ms
64 bytes from 172.66.148.147: icmp_seq=3 ttl=55 time=16.5 ms
64 bytes from 172.66.148.147: icmp_seq=4 ttl=55 time=19.1 ms
64 bytes from 172.66.148.147: icmp_seq=5 ttl=55 time=15.1 ms
64 bytes from 172.66.148.147: icmp_seq=6 ttl=55 time=19.8 ms
64 bytes from 172.66.148.147: icmp_seq=7 ttl=55 time=18.5 ms
64 bytes from 172.66.148.147: icmp_seq=8 ttl=55 time=15.9 ms
^C
--- 172.66.148.147 ping statistics ---
8 packets transmitted, 8 received, 0% packet loss, time 7008ms
rtt min/avg/max/mdev = 15.058/17.464/19.843/1.656 ms

$ ping api.roonlabs.net
PING api.roonlabs.net (2606:4700:10::ac42:9493) 56 data bytes
64 bytes from 2606:4700:10::ac42:9493: icmp_seq=1 ttl=54 time=19.4 ms
64 bytes from 2606:4700:10::ac42:9493: icmp_seq=2 ttl=54 time=24.3 ms
64 bytes from 2606:4700:10::ac42:9493: icmp_seq=3 ttl=54 time=18.3 ms
64 bytes from 2606:4700:10::ac42:9493: icmp_seq=4 ttl=54 time=22.4 ms
64 bytes from 2606:4700:10::ac42:9493: icmp_seq=5 ttl=54 time=23.9 ms
64 bytes from 2606:4700:10::ac42:9493: icmp_seq=6 ttl=54 time=25.4 ms
64 bytes from 2606:4700:10::ac42:9493: icmp_seq=7 ttl=54 time=18.8 ms
64 bytes from 2606:4700:10::ac42:9493: icmp_seq=8 ttl=54 time=21.1 ms
64 bytes from 2606:4700:10::ac42:9493: icmp_seq=9 ttl=54 time=19.2 ms
64 bytes from 2606:4700:10::ac42:9493: icmp_seq=10 ttl=54 time=14.4 ms
64 bytes from 2606:4700:10::ac42:9493: icmp_seq=11 ttl=54 time=23.2 ms
^C
--- api.roonlabs.net ping statistics ---
11 packets transmitted, 11 received, 0% packet loss, time 11255ms
rtt min/avg/max/mdev = 14.364/20.944/25.437/3.130 ms
For what it’s worth, I seem to have the same issue since yesterday. Local playback works, ARC is iffy, and Qobuz integration is totally borked (Qobuz standalone works fine).
FWIW, there seems to be some issue with metadataserver.roonlabs.net as well. It’s pingable
$ ping metadataserver.roonlabs.net
PING metadataserver.roonlabs.net (35.231.208.158) 56(84) bytes of data.
64 bytes from 158.208.231.35.bc.googleusercontent.com (35.231.208.158): icmp_seq=1 ttl=103 time=47.9 ms
64 bytes from 158.208.231.35.bc.googleusercontent.com (35.231.208.158): icmp_seq=2 ttl=103 time=51.9 ms
64 bytes from 158.208.231.35.bc.googleusercontent.com (35.231.208.158): icmp_seq=3 ttl=103 time=47.1 ms
64 bytes from 158.208.231.35.bc.googleusercontent.com (35.231.208.158): icmp_seq=4 ttl=103 time=47.4 ms
64 bytes from 158.208.231.35.bc.googleusercontent.com (35.231.208.158): icmp_seq=5 ttl=103 time=51.6 ms
64 bytes from 158.208.231.35.bc.googleusercontent.com (35.231.208.158): icmp_seq=6 ttl=103 time=47.0 ms
64 bytes from 158.208.231.35.bc.googleusercontent.com (35.231.208.158): icmp_seq=7 ttl=103 time=48.7 ms
64 bytes from 158.208.231.35.bc.googleusercontent.com (35.231.208.158): icmp_seq=8 ttl=103 time=49.2 ms
64 bytes from 158.208.231.35.bc.googleusercontent.com (35.231.208.158): icmp_seq=9 ttl=103 time=48.0 ms
64 bytes from 158.208.231.35.bc.googleusercontent.com (35.231.208.158): icmp_seq=10 ttl=103 time=50.9 ms
64 bytes from 158.208.231.35.bc.googleusercontent.com (35.231.208.158): icmp_seq=11 ttl=103 time=49.5 ms
^C
--- metadataserver.roonlabs.net ping statistics ---
11 packets transmitted, 11 received, 0% packet loss, time 10014ms
rtt min/avg/max/mdev = 46.999/49.003/51.915/1.696 ms
but
08/24 17:09:48 Warn: [metadatasvc] FAIL [263] https://metadataserver.roonlabs.net/md/4/updatemetadata?uid=...[snip]...&tidal=max (100007ms) NetworkError
08/24 17:09:48 Warn: [updatemetadata] neterror in updatemetadata: Result[Status=NetworkError]
Suedkiez
August 24, 2025, 11:20pm
6
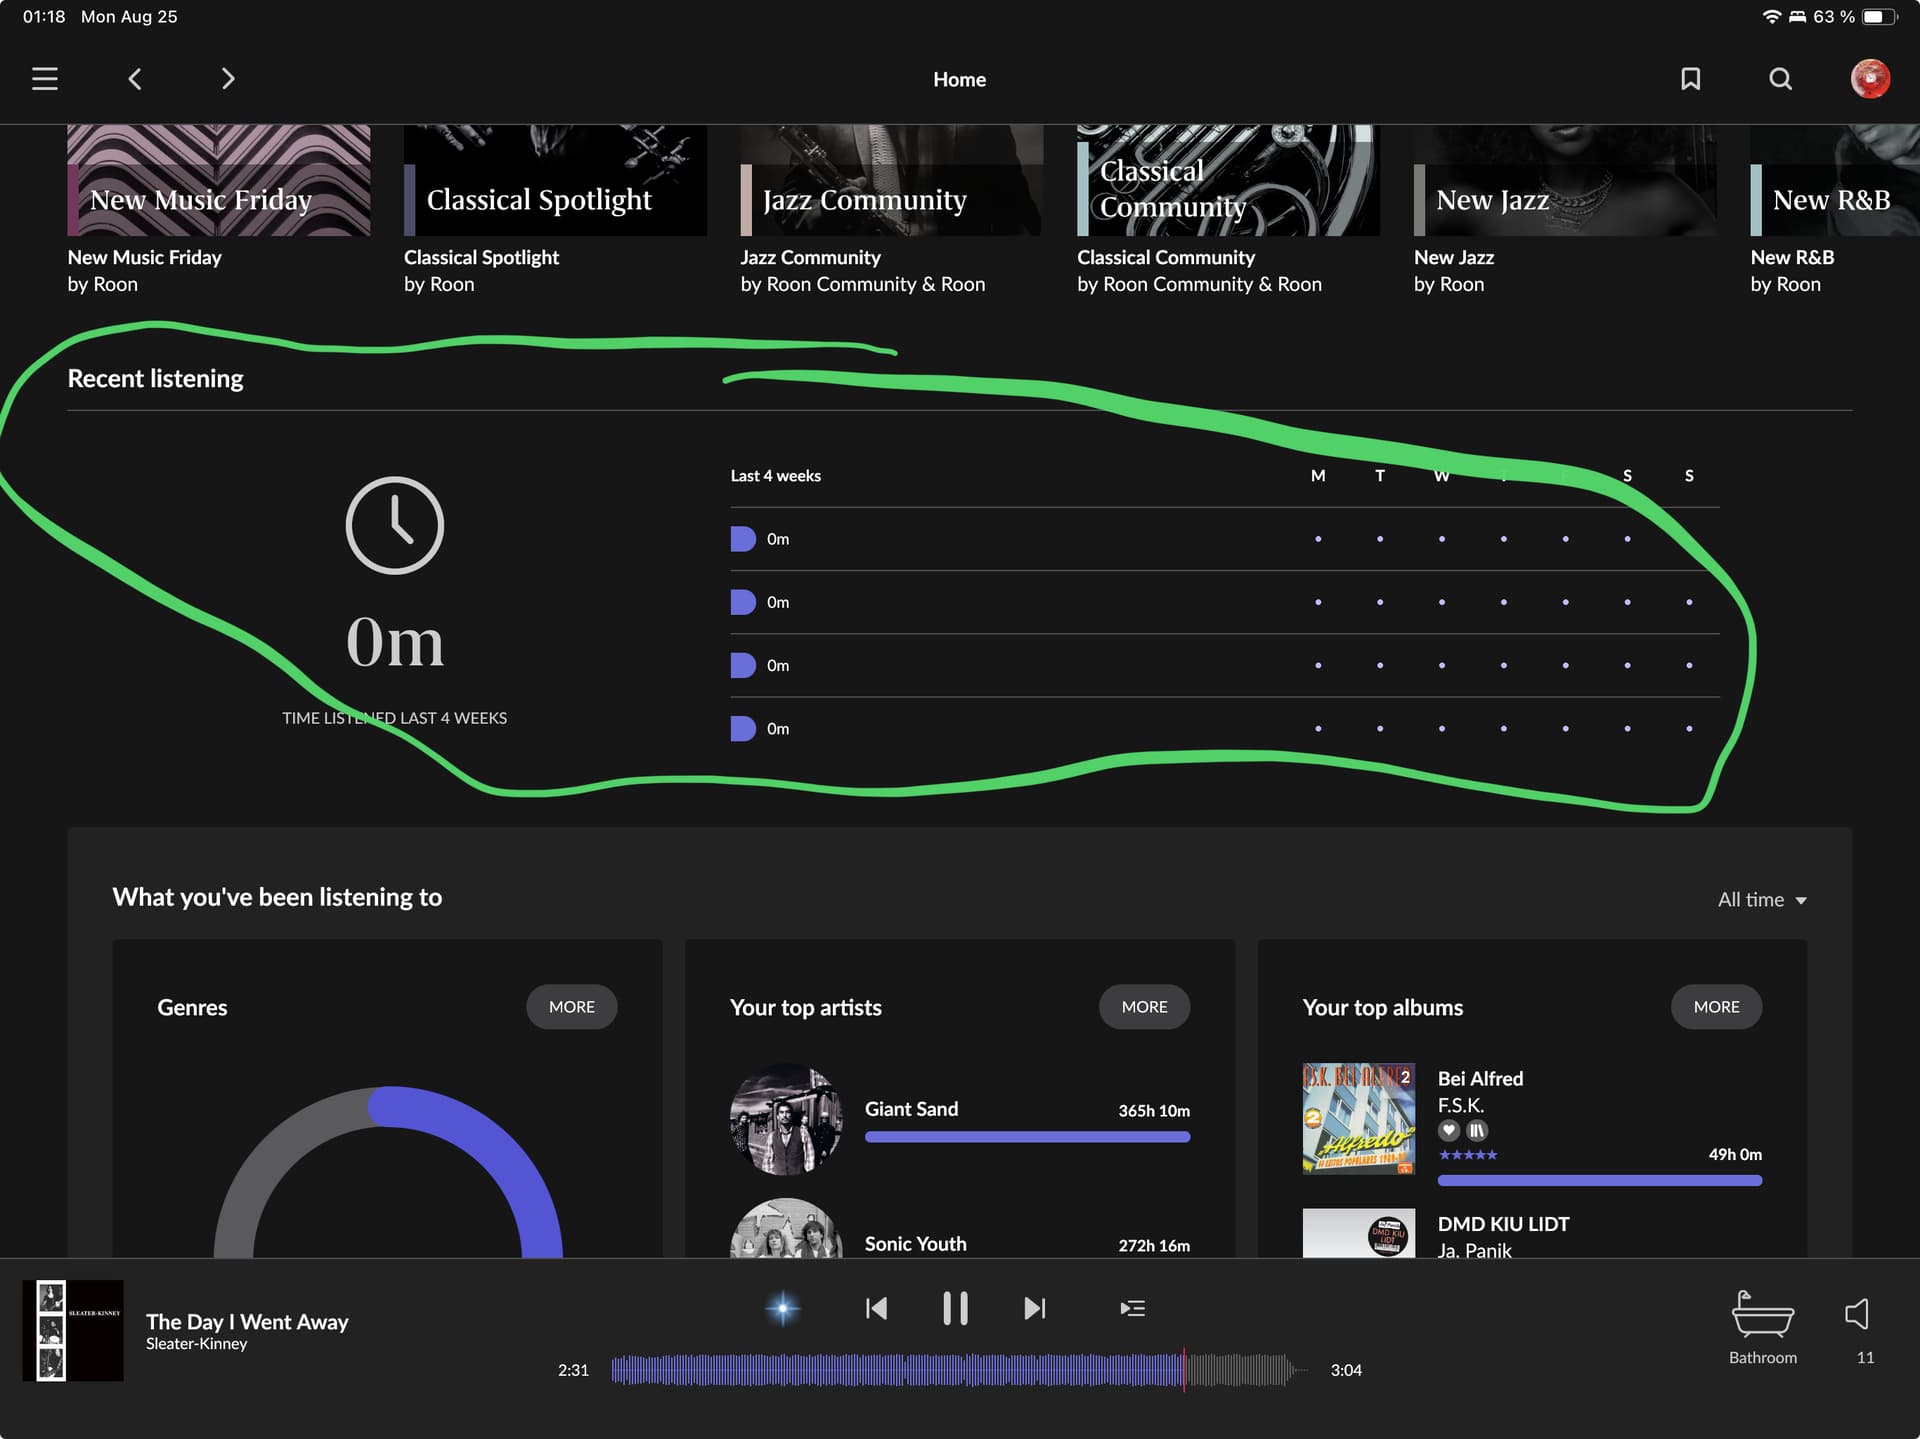
Yeah, something is off in the cloud, the recent listening is also gone
Somethings been amiss since the update IMHO.
They’re getting ready for this big change to not ignore IPv6. I think someone dropped the ball and left the work in progress changes active and deployed it for some users.
Or it’s a local server issue to some users.
Either way, a number of users over the weekend have faced different issues but seem to point to cloud related causes.
vadim
August 25, 2025, 11:24am
8
Hello @Jacques_Distler
To help us better understand why Roon may experience timeouts, could you please perform a traceroute to api.roonlabs.net from your Roon Core machine?
On Windows , open Command Prompt and run:
tracert api.roonlabs.net
On Linux/macOS , open Terminal and run:
traceroute api.roonlabs.net
Please share the full output. This will help us see if there are any routing issues or packet drops between your network and the Roon servers.
All the addresses for api.roonlabs.net now respond to pings
$ traceroute 172.66.148.147; traceroute 104.20.47.62

traceroute to 172.66.148.147 (172.66.148.147), 64 hops max
  1   192.168.0.1  0.620ms  0.211ms  0.287ms
  2   72.182.32.1  14.657ms  13.155ms  10.952ms
  3   66.68.2.1  25.637ms  33.754ms  32.437ms
  4   24.175.57.84  11.963ms  14.396ms  11.505ms
  5   24.175.57.90  11.970ms  12.667ms  14.163ms
  6   24.175.41.48  17.298ms  20.019ms  13.948ms
  7   *  66.109.6.108  39.922ms  *
  8   *  *  66.109.6.39  32.576ms
  9   209.18.43.77  29.634ms  21.247ms  17.204ms
 10   141.101.74.104  25.476ms  21.314ms  22.541ms
 11   141.101.74.63  24.850ms  23.110ms  22.611ms
 12   172.66.148.147  26.082ms  24.539ms  24.976ms

traceroute to 104.20.47.62 (104.20.47.62), 64 hops max
  1   192.168.0.1  0.245ms  0.221ms  0.194ms
  2   72.182.32.1  10.625ms  12.881ms  11.124ms
  3   66.68.2.1  20.953ms  25.179ms  33.721ms
  4   24.175.57.84  8.521ms  14.904ms  5.842ms
  5   24.175.57.90  9.844ms  16.135ms  9.254ms
  6   24.175.41.48  24.248ms  19.411ms  16.029ms
  7   *  *  66.109.9.88  18.335ms
  8   *  66.109.6.90  21.108ms  *
  9   66.109.5.121  18.726ms  21.258ms  27.531ms
 10   141.101.74.104  26.970ms  20.528ms  21.980ms
 11   141.101.74.199  26.627ms  25.656ms  23.662ms
 12   104.20.47.62  25.739ms  21.077ms  20.839ms

$ ping 172.66.148.147
PING 172.66.148.147 (172.66.148.147) 56(84) bytes of data.
64 bytes from 172.66.148.147: icmp_seq=1 ttl=54 time=18.7 ms
64 bytes from 172.66.148.147: icmp_seq=2 ttl=54 time=22.2 ms
64 bytes from 172.66.148.147: icmp_seq=3 ttl=54 time=23.7 ms
64 bytes from 172.66.148.147: icmp_seq=4 ttl=54 time=20.0 ms
64 bytes from 172.66.148.147: icmp_seq=5 ttl=54 time=19.0 ms
64 bytes from 172.66.148.147: icmp_seq=6 ttl=54 time=17.6 ms
64 bytes from 172.66.148.147: icmp_seq=7 ttl=54 time=23.5 ms
64 bytes from 172.66.148.147: icmp_seq=8 ttl=54 time=19.3 ms
64 bytes from 172.66.148.147: icmp_seq=9 ttl=54 time=23.1 ms
64 bytes from 172.66.148.147: icmp_seq=10 ttl=54 time=24.8 ms
64 bytes from 172.66.148.147: icmp_seq=11 ttl=54 time=19.1 ms
^C
--- 172.66.148.147 ping statistics ---
11 packets transmitted, 11 received, 0% packet loss, time 10013ms
rtt min/avg/max/mdev = 17.555/21.005/24.841/2.384 ms

$ ping 104.20.47.62
PING 104.20.47.62 (104.20.47.62) 56(84) bytes of data.
64 bytes from 104.20.47.62: icmp_seq=1 ttl=54 time=26.7 ms
64 bytes from 104.20.47.62: icmp_seq=2 ttl=54 time=18.8 ms
64 bytes from 104.20.47.62: icmp_seq=3 ttl=54 time=18.0 ms
64 bytes from 104.20.47.62: icmp_seq=4 ttl=54 time=17.6 ms
64 bytes from 104.20.47.62: icmp_seq=5 ttl=54 time=21.0 ms
64 bytes from 104.20.47.62: icmp_seq=6 ttl=54 time=20.5 ms
64 bytes from 104.20.47.62: icmp_seq=7 ttl=54 time=23.1 ms
64 bytes from 104.20.47.62: icmp_seq=8 ttl=54 time=22.4 ms
64 bytes from 104.20.47.62: icmp_seq=9 ttl=54 time=20.4 ms
^C
--- 104.20.47.62 ping statistics ---
9 packets transmitted, 9 received, 0% packet loss, time 8009ms
rtt min/avg/max/mdev = 17.630/20.951/26.662/2.670 ms
More importantly, I’m not seeing the timeouts in the Roonserver logs that I was seeing yesterday.
1 Like
Suedkiez
August 25, 2025, 6:01pm
10
The recent listening stats are fixed again
1 Like
noris
August 26, 2025, 8:43pm
11
Hello @Jacques_Distler ,
Thanks for letting us know that the behavior has subsided and that everything has returned to normal. This was likely an intermittant issue that has since been resolved, I’ll go ahead and mark this thead for closure but should you see any further disrepencies, do let us know. Thanks!
system
August 27, 2025, 8:44pm
12
This topic was automatically closed 24 hours after the last reply. New replies are no longer allowed.