Do you think the issue should be fixed in this release? IDK but it seems unlikely to me that a Roon Server memory leak got fixed by a (desktop) client only release.
Hi, @Mr.Flibble, could you please share more details about your spare machine (library size, etc)? What are the current numbers for the memory in use? I will be talking to the dev team a bit later today.
I’ve uploaded last nights log to the link you provided last time. It’s marked - mrflibble_b1547
Library size with these logs is 118k tracks
It’s an i5-8500T, 32gb RAM. running Rock.
I haven’t looked too much at it, but increase still occurred but maybe at a slower rate. My backup(s) kicked in as it was a fresh install and the amount in use drops. It showed a small increase following the backups.
As some say, the increase occurs even without use.
I have left my machine running while I’m out, but it’s running a slightly different library (part local and part Qobuz) approx same total as above.
I’m seeing early signs that there may be improvement in B1547.
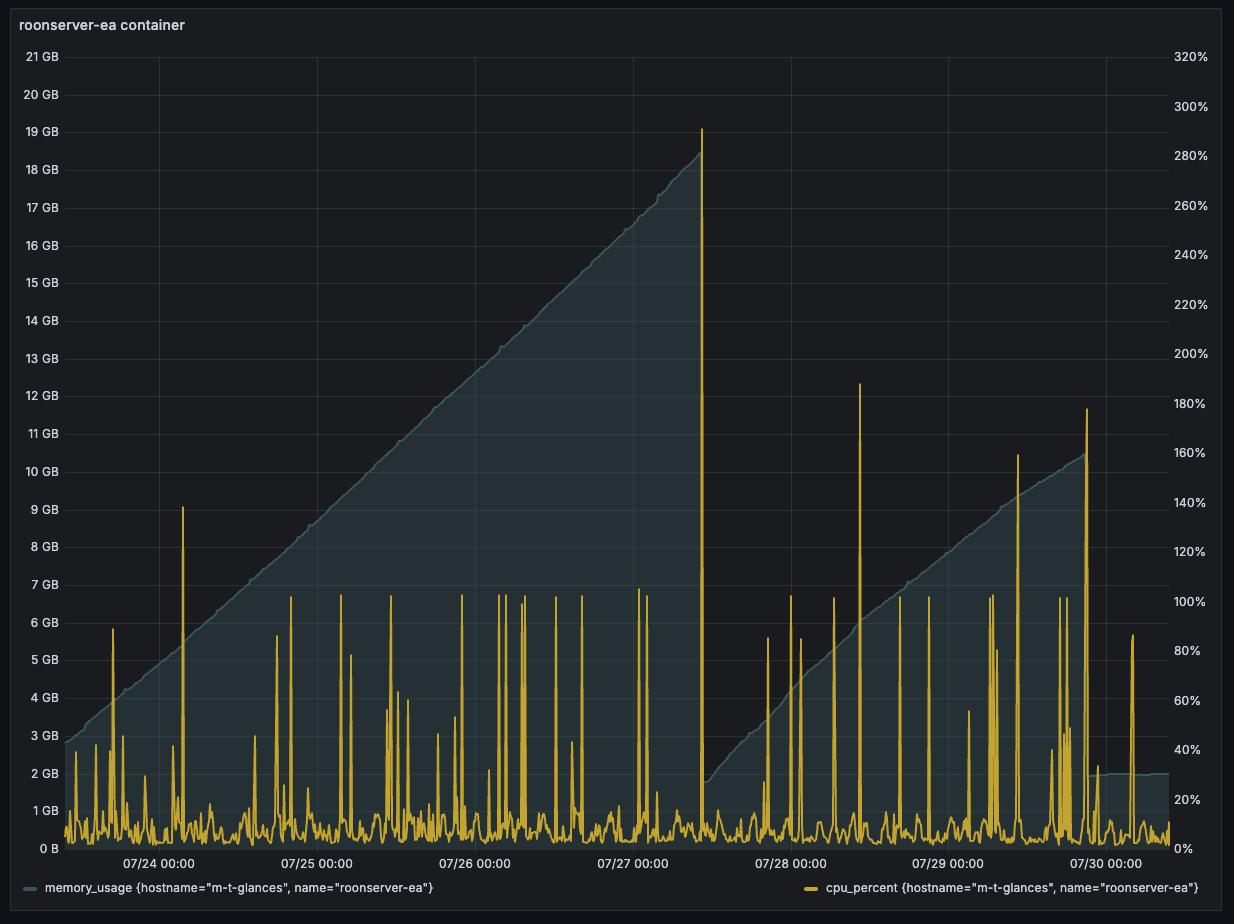
In the image below, you see B1546 beginning shortly after installation. Memory usage increases steadily until it exceeds 18GB at which point I restarted the container. Memory immediately begins to grow again until it reaches 10GB at which point I installed B1547. Since then, memory has been flat.
I’ve seen behavior like this on production builds where memory is initially flat and then starts to grow, so this needs to be watched. I’ll report again when I have more data.
@vova - Is it possible to have a little more transparency about the investigation and what changes were included in this build, if any? Is this being investigated, for example, as a garbage collection issue, a memory leak, both, or something else? Is it specific to the environments of those of us who it is impacting? Thanks for considering this.
@ivan just wondering if it’s @ben you have been in discussions with. I linked a post in the B1546 thread from Sept 2023 in which @ben was looking into this exact same issue. Did he get to the bottom of the issue, or……….?
I’m the dev who has been working on this, I’ll make an attempt to explain. I’m going to answer your questions a little out of order so the explanation is in what looks like a logical order to me.
I’ve been thinking of it as basically a collection of memory leaks of various sizes, where the primary issue is that we are keeping references to things that are no longer really in use. That leaves the garbage collector unable to free them, and memory usage increases.
Starting from the beginning of my our recent work on this, we have changes in these builds:
EA build 1541 / production build 1544: Specifically removed the reference from zone objects to the play queue list when the zone is deactivated. This was a stopgap type fix that wasn’t expected to resolve everything
EA build 1546:
Addressed a bunch of event handler leaks. One of the fixes here is actually the cause of the RoonApi issue in this build
reworked how we retain references to old versions of objects in our internal multi-version concurrency control (MVCC) system. This system is the thing that prevents problems caused by (for example) metadata updates to an album while the remote is viewing the same album. It was retainining references to old versions much longer than it should, potentially indefinitely.
reworked how some of our internal components interacted with the MVCC system, again to resolve references to old versions sticking around when they shouldn’t
EA build 1547: fixed a bug in the rework for (2) in build 1546.
I think at this point in Roon’s life cycle all bugs are at least a little specific to some user’s environment, because we catch the completely generic ones quickly. Some of these fixes are more specific than others:
Some of the event handler leaks required actually using RoonApi/extensions
The problem that forced the MVCC reworked was actually on Roon Remote, and probably required a Mac or Windows client talking to the server
some of the changes in 1547 are actually intended to address leaks that happen when there are very few metadata updates to library objects, which happens more for small libraries that are not being changed
I have a hypothesis that this leak is caused by something that triggers when RoonServer thinks it’s ability to connect to the internet has changed. I’ve changed a configuration setting on our side to throttle that trigger very severely, can you try restarting RoonServer twice to ensure it’s taken effect and then let us know if you see any change in the memory usage patterns?
Thank you, Ben, for the information and transparency. I appreciate it.
Am I correct in assuming that this change is in your cloud service and should apply to both prod and EA? I’ve now restarted both of my instances twice and will monitor them. Unfortunately only one is authorized at a time so if authorization state matters, that could impact what I see.
In case this helps, I currently run just one extension, which is Home Assistant. I use this, with custom physical volume knobs, to control the volume. I started seeing odd behaviors with volume control in the last production release but assumed this was something on my end. The behavior was that volume commands wouldn’t work after initiating play on a zone until I’d directly adjusted the volume on the zone. Prior to the current production release, I wasn’t having that problem. But I have changed gear and fiddled with automations recently, so it could be that.
Tracking down these managed memory “leaks” can be really hard. If there’s something I can do to help with my instances, just let me know.
One pattern I’ve used in the past is to create a collection of WeakReference for things I think should be garbage collected but might not be. In the constructor of T, add a weak reference to this global collection. Then when you want to see what’s happened do something like:
GC.Collect();
GC.WaitForPendingFinalizers();
GC.Collect(); // be sure
Then walk the collection and see what objects are still around by calling TryGetTarget.
Sometimes that sort of brute force thing is the best you can do. Especially when you’re trying to debug this in someone else’s setup. If you want to put some additional logging for this, or whatever, into an EA release to help debug, I’m happy to help and I’m sure others here are, too.
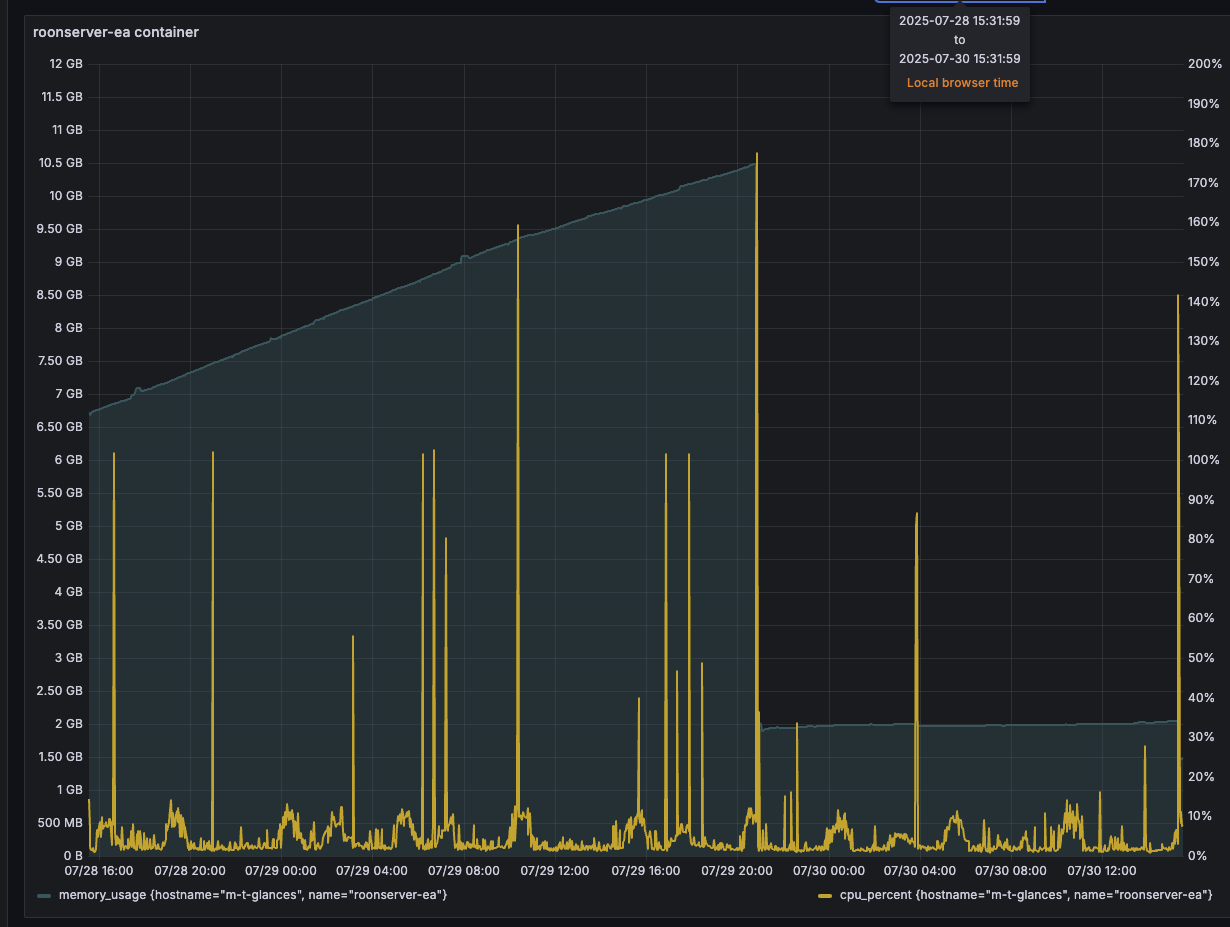
Here’s an update from my EA instance.The CPU spke at the right side is the two restarts you requested, @ben. It really does look to me that build 1547 changed something significant for me.
It is in our cloud service, but I had only actually made the change for the one @Mr.Flibble’s account. It’s set for yours as well now.
I’m finishing up for the night now, but I’ll try to remember to write a more complete response in the morning. One of the reasons I’m in dev and not tech support is that staying on top of stuff like this is not one of my strong points, so apologies in advance if I forget.
For the past few hours, Roon Server has been sitting at 5390mb +/- 4mb which is has been since the second restart, give or take.
Based on 118k library this would suggest 1gb more than I have previously started with.
I’ve enabled my Qobuz library (previously added but disabled) and memory has risen to 6351mb for 201k tracks which appears inline with (my) expectations.
I have had several instances recently where music gets garbled up shortly before a zone drop/disappear. This stays ugly until a NUC reboot so I assume is likely a memory overload. Has been persistent for a while. I haven’t had much time to use it in the last week to see if the improvements are there.
Using ROCK EA on a NUC, are the B1547 memory leak fixes applicable generally or are you applying to specific account just now ?