Yes it sounds amazing, really great learning experience, thank you @OCA
Yes L2 is the original recording with no corrections
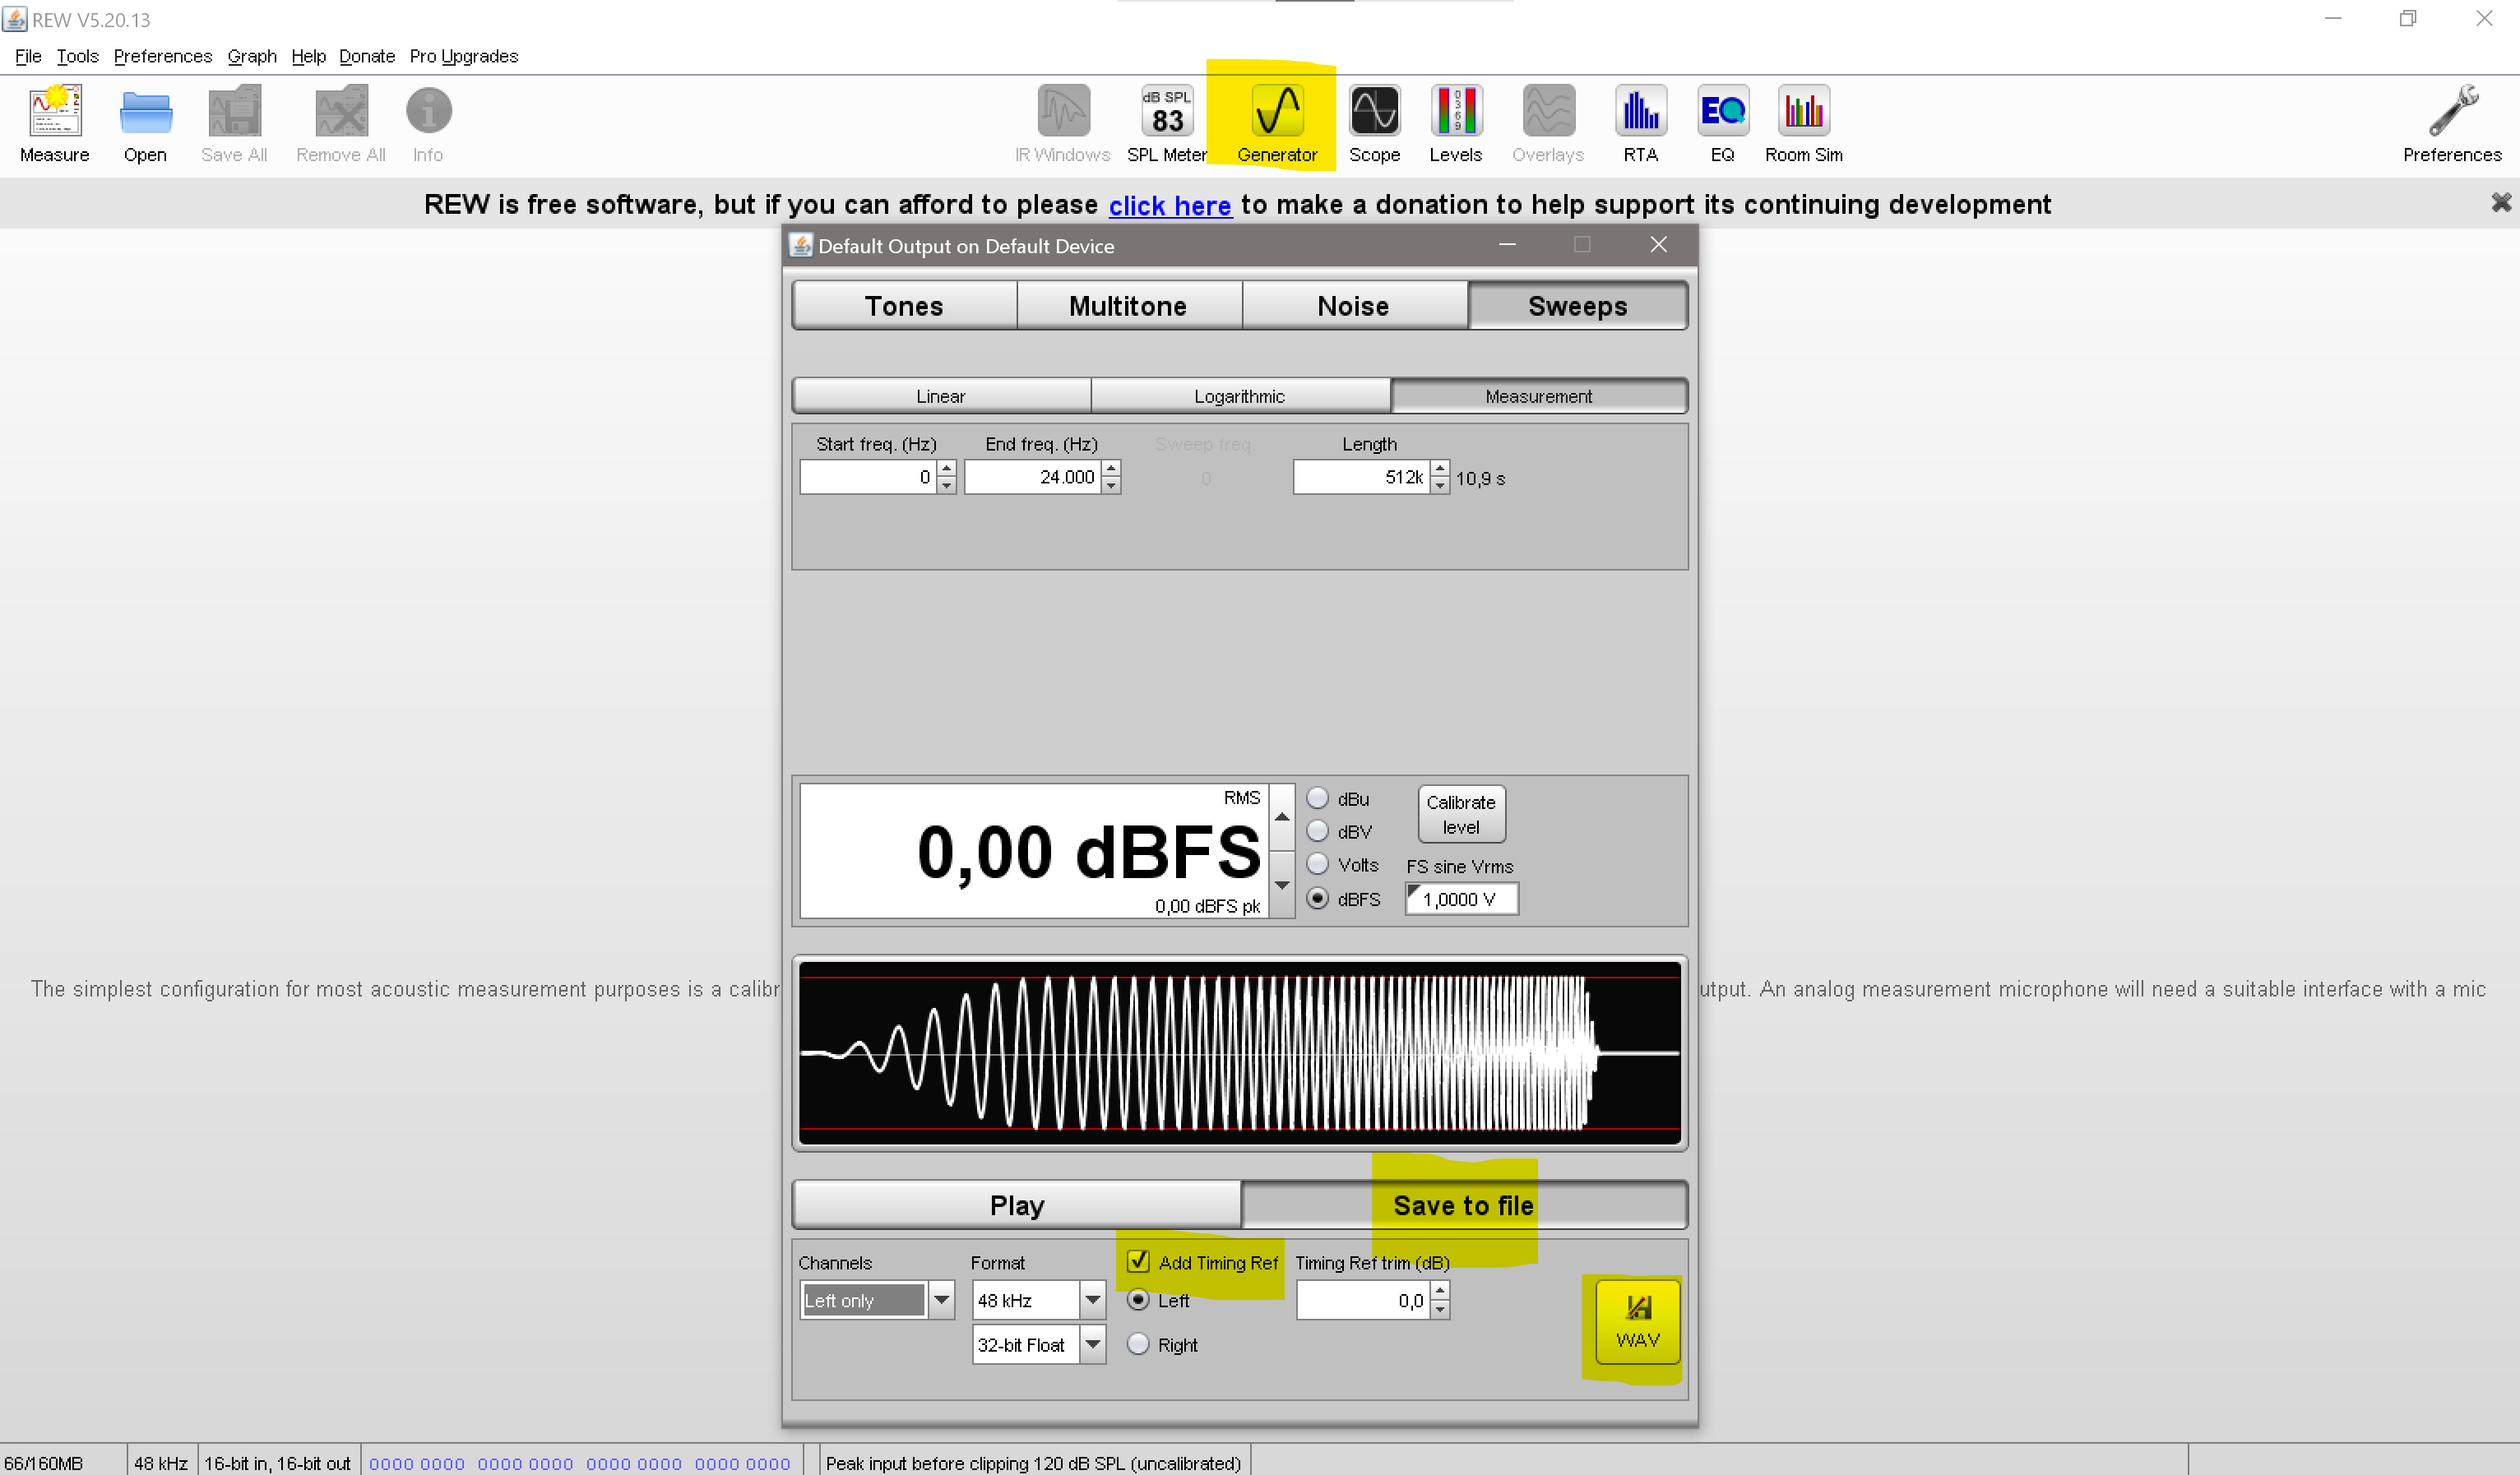
Open REW’s signal generator dialogue, check respective options at the bottom, export as wav file, then transfer to Roon’s watched folder and play as you do with any other music.
EDIT:
Start measurement in REW, then start playing file and REW detects the acoustic timing chirps to properly take data - bada bing, bada boom!
2 Likes
Thanks @Marin_Weigel
The results are outstanding. Thanks for the education. Really nice!
1 Like
Happy to hear that.
I’m now working with John on something even better. Stay tuned ![]()
6 Likes
Serkan, thank you for sharing your wisdom and passion on this, and for the video and guide. Remarkable and excellent from my standpoint.
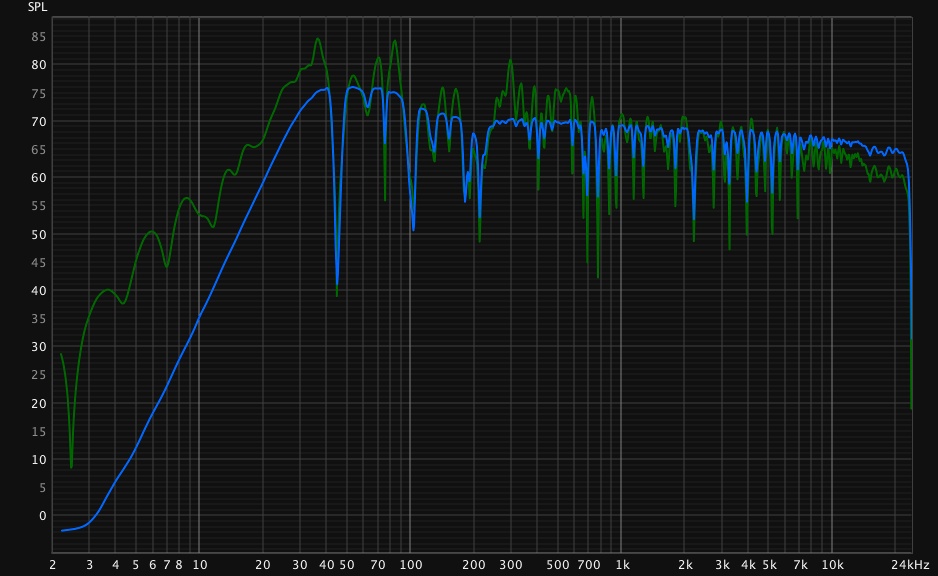
I have successful created my first corrected curve (without RePhase yet, because I run on Mac OS), and the SQ results are already very meaningful. I will continue to try to learn from you and this community to tune my own 1st trial, and improve upon it.
Here are the comparison between original and corrected, for L and then for R.
1 Like
Serkan, can you please help us better understand how / why you arrived at the 3.6 dB target level, or point us to some reading about it?
The math behind 1/A inversion is quite complicated and in even frequency domain, fast fourier transform amplitudes need a 20.log(x/y) conversion to be expressed in dB terms. It’s a bit of optimization through trial and error but you can think of it as an average for a total of around 7dB overall drop in the Harman target curve from bass towards the high frequencies. 3.6 dB target allows the trace arithmetic operation to allow up to a max of 3.6 dB boost of dips which brings the intended peak corrections right on the target curve at 8% regularization. You can try different regularization percentages and different target volume levels, AxB them with the original measurements and compare the results. Higher regularization ratios cut off dip boosts more aggressively. For instance, at 25% reg. there will be no boost at all to dips but then it corrects too much for the peaks.
Admittedly, I’ve even developed an Excel macro which takes a measurement and eliminates all the dip corrections and exports a perfect peak correction response to REW where AxB yields the perfect result on graph. But when I measured and compared the actual speaker response of this filter with the 8% reg, 3.6 dB filter, I didn’t see any improvement. In fact, the latter gave very slightly better results.
3 Likes
Got it, thank you.
I have a couple more questions…
-
My listening room is symmetrical from a shape standpoint (rectangular), but there is a large window on the side wall of the left speaker, and an opening to another room on the side wall of the right speaker, each resulting in their own disturbances and reflections… My question therefore is why create the L and R inverted-MPs on the basis of an averaged target LR curve, and not L against a target L curve, and R against a target R curve? I feel the target LR is somewhat a meaningless average, leading to include some corrections in R related to L, and vice versa…
-
On step 10-13 of your Correction Process, Impulse Correction, I saw that both my speakers are too close to the LP, which is not what I was expecting, as I thought one would be too close (below 0), and the one too far (above 0). Is this possible, or a user error (like the microphone was moved inadvertently a few mm between the L and the R measurements. Here are the measurements for L and R impulse peaks.
- On step 13-Optional, to align the right end tip of the phase graphs, I cannot figure out how to do this without changing the alignment of the peaks we just adjusted on steps 11-13. What am I missing?
1.If you correct left and right speakers separately for each one’s best target curve, you will have two speakers sounding at their best at their location but incoherent with each other. Coherence between speakers is more important in the overall sound than anything else. Feel free to try and test though.
2. The difference between the distances of your speakers to LP is only 1 mm which means the mic was almost perfectly in the middle. Impulse peaks may or may not be around time zero depending on the delays on your system and other REW settings so time zero for you could be between the two peaks like 0.5 mm each. Just time align them before calculating the correction files and don’t worry about the delays or speaker placement as you cannot even accurately dial in 1 mm difference in Roon speaker settings.
3. The time offset you dial in in rePhase does not effect your REW impulse responses (it’s not carried over in the exported wav file), it’s just there for visual purposes.
2 Likes
Serkan, thank you and understood.
On the impulse peak, with that 1mm difference, do I need to shift both speakers 0.5mm each, or can I simply shift one speaker 1mm towards the other?
One more question, on “taps”. I read in this thread and others that you recommend setting up filters with less “taps”, if I understand correctly. In my various tests, I have seen Roon convolution running at 50K taps, and up to 241k taps. I am not sure I understand “taps”, and where I optimize for “taps” during the filter design. Can you help?
Dear @OCA,
What a fantastic guide have you provided. I was never fond of applying DSP to the full spectrum, even though it works quite well on my subwoofer. Having tried the REW EQ filter method in the past to create convolution filters against the Harman curve I was never impressed.
However, I have now carefully followed your tutorial and I am flabbergasted by the results! It has never sounded as good as this in my room: more spacious, balanced, without losing any of the liveliness in the presentation. Great!
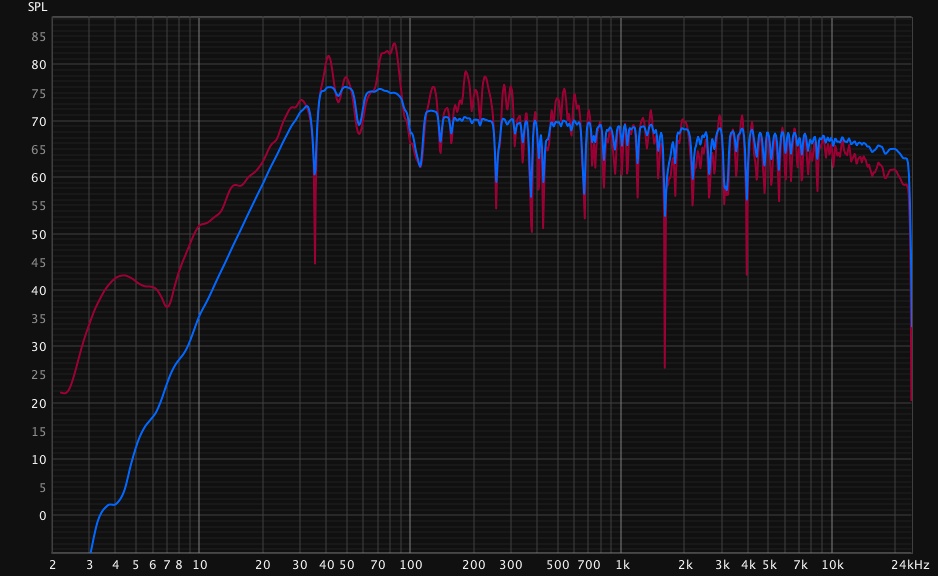
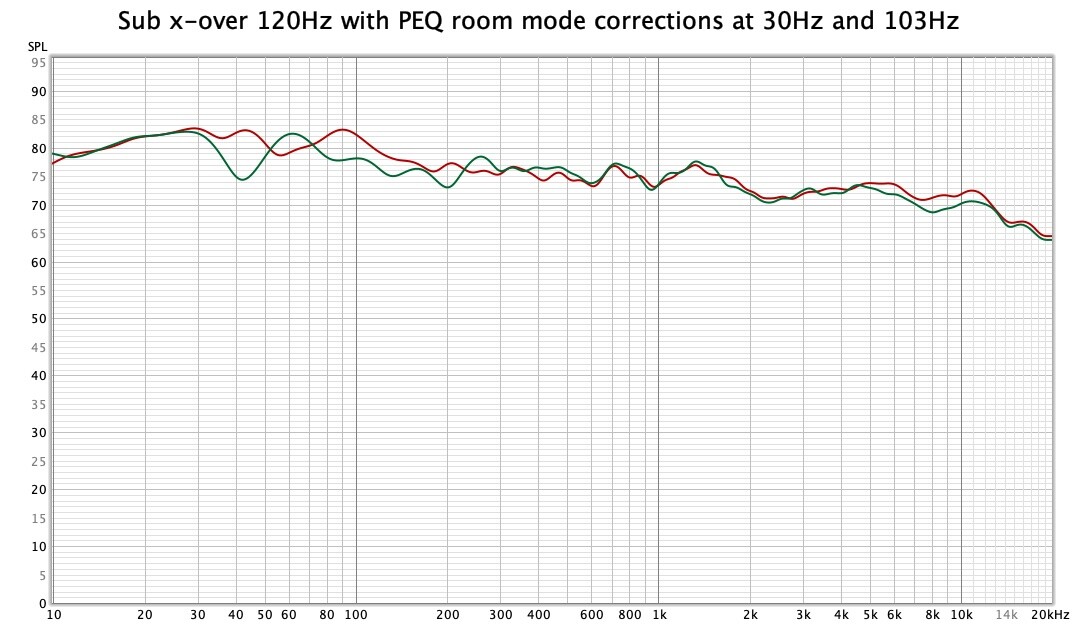
Below a copy of my initial measurements (red = left channel) with two room mode corrections applied in the sub at 30Hz and 103Hz. On top of that I now apply the convolution filter in Roon and I could not be more happy with the current sound. Thank you for this excellent tutorial!
BR,
Richard
2 Likes
I concur, my results with this method have been absolutely stellar.
@OCA’s hint at “something even better” is enticing to say the least!
2 Likes
Sorry I’ve missed this question, You can do whichever is more convenient for you as long as two speakers end up equal distance from LP. Or you don’t move speakers but dial-in the delays in Roon speaker set up. 1mm wouldn’t make any audible difference though.
Roon adjusts the number of taps according to the sample rate of the audio played. When desigining the crossover phase filter in rePhase , I choose 65536 which doesn’t cause any audible delay and is high enough to cover even the deepest bass frequencies. As long as you export convolution filters with short IR Windows applied in REW (125ms front and 500ms rear for example), you will not have any delays while switching songs in Roon no matter how many taps you’ve used in rePhase.
1 Like
When grouping with other zones, that 125ms “impulse response left window” adds as a delay to that endpoint with nothing you can do to remedy that.
That echo effect does sound bothersome.
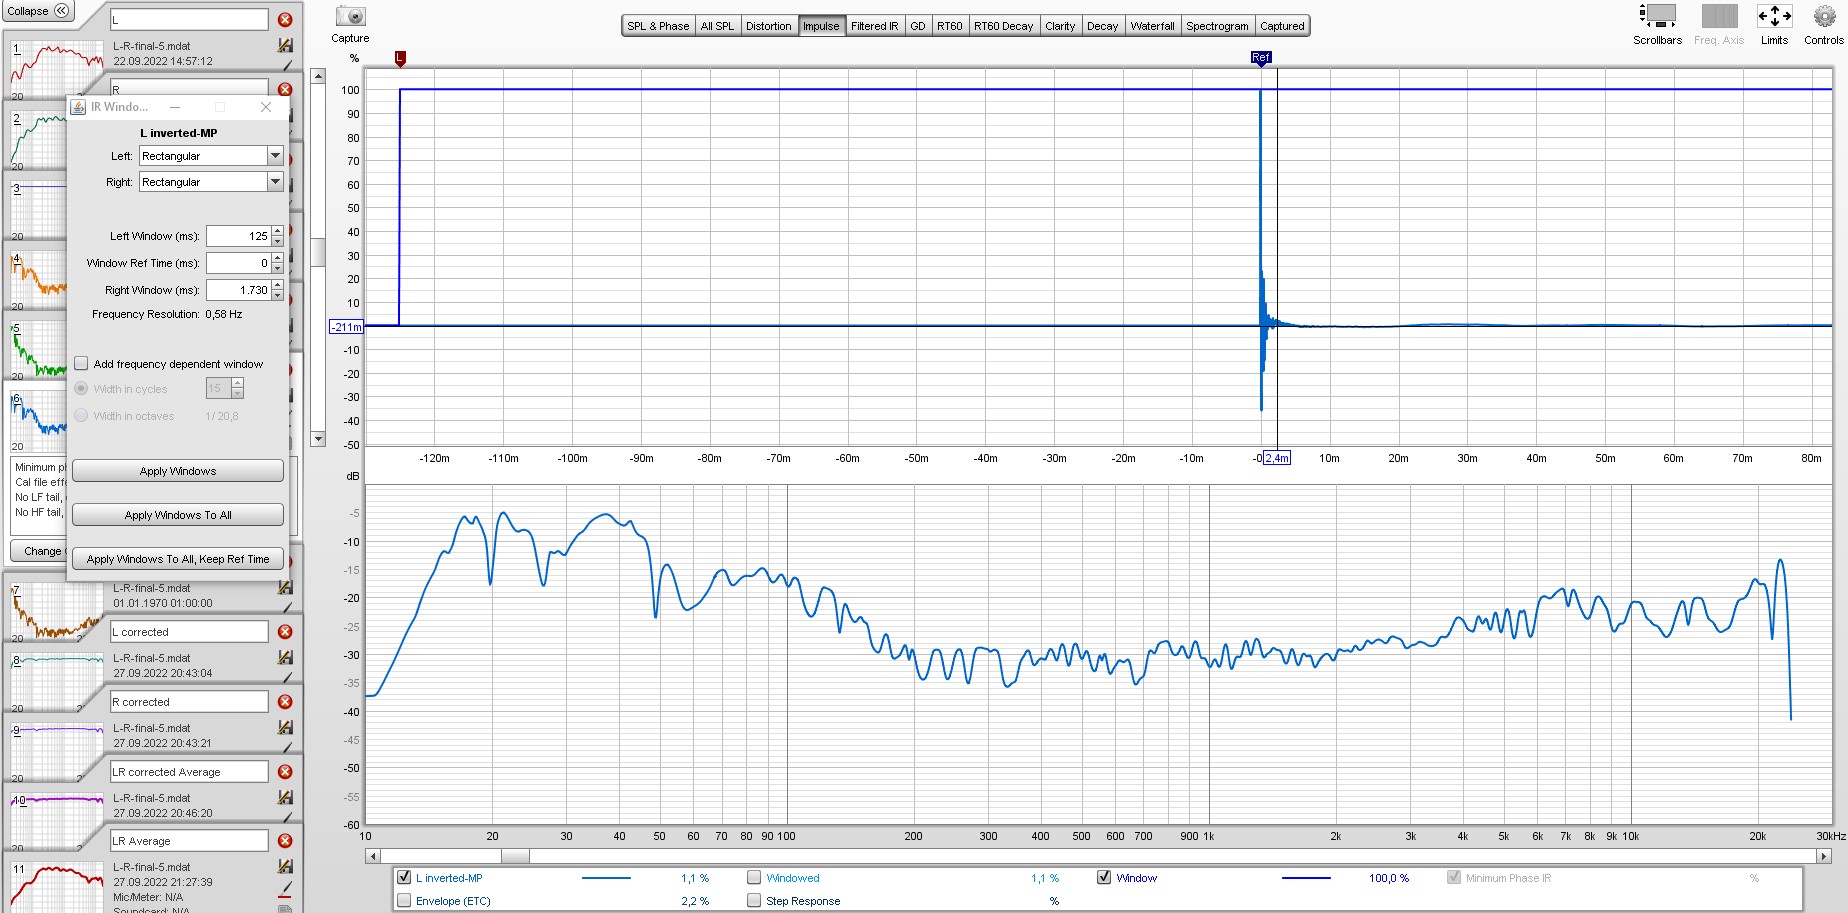
For that reason, I did my correction files with a rectangular window and about 29us left window, just where my step starts rising from the 0-line.
Just saying…
True, you flatten the initial fluctuations in step response thus avoid pre-echo with very tight left windowing but you’ll change the magnitude response of the correction too much. You can check the exact effect under the impulse tab with show magnitude graph option ticked. I cannot go below 50 ms comfortably most of the time.
Interesting comment, I’ll certainly double check that to your recommendation.
I did compare the corrected response plots with recommended vs. my windowing but couldn’t find any appreciable difference.
Even right window size effects the correction, below a certain window size you will completely delete bass correction for example. Best way is to try in impulse tab.
1 Like
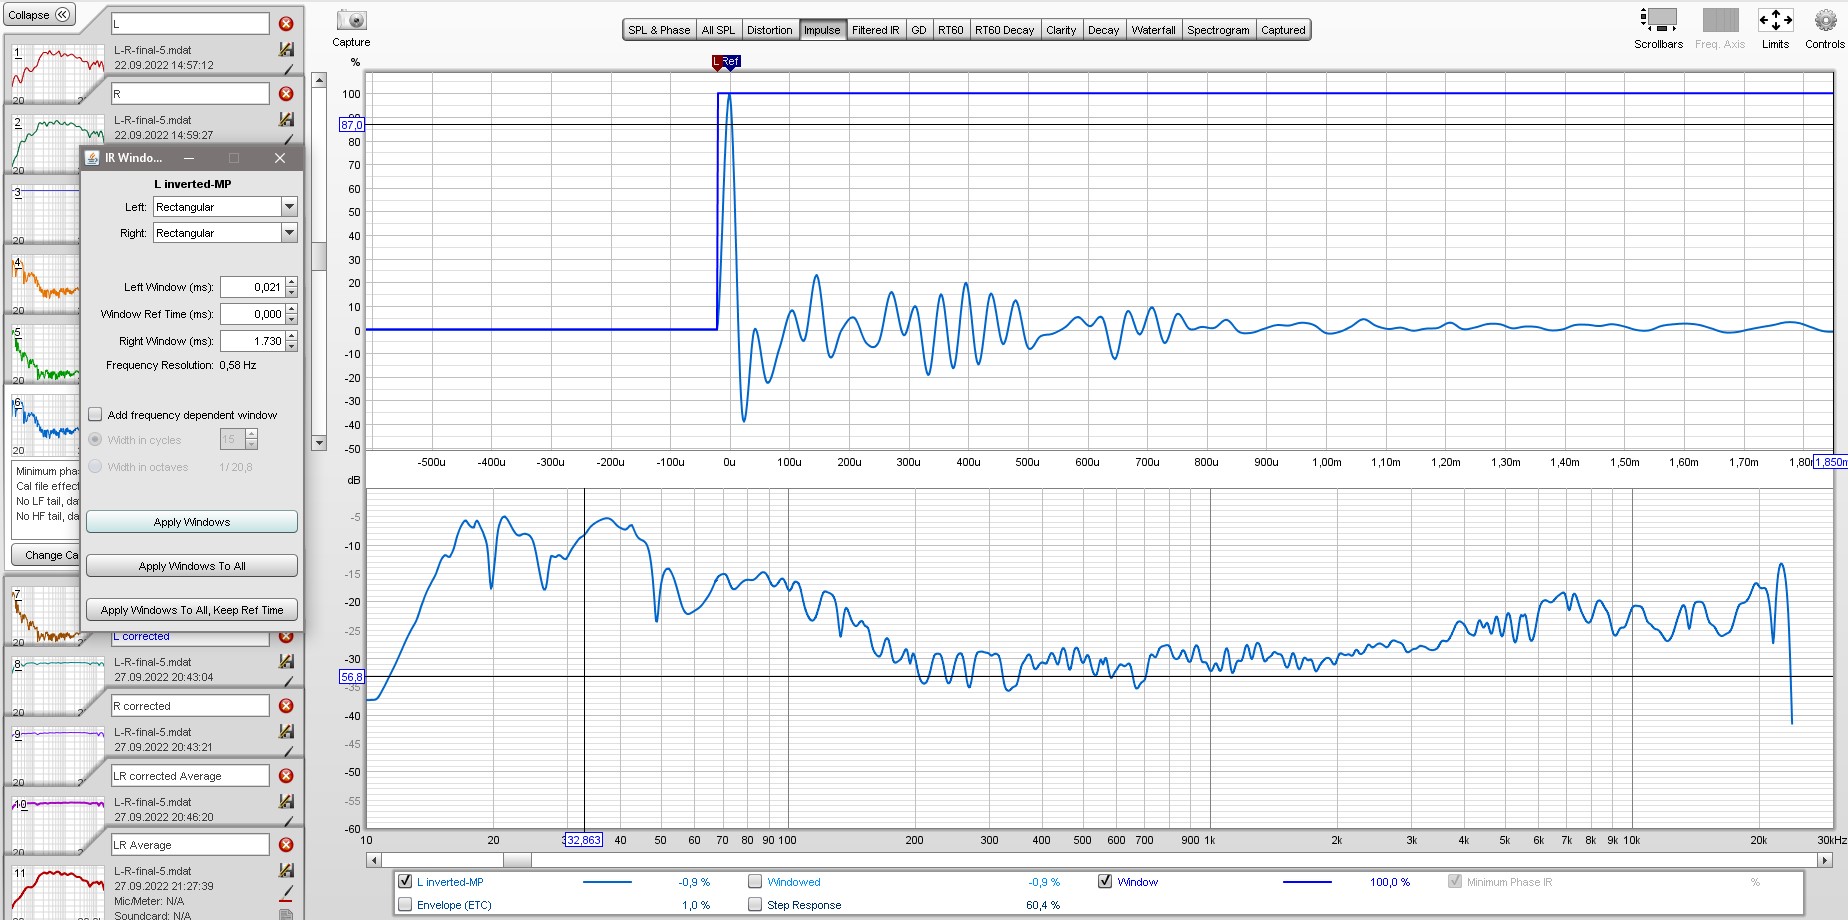
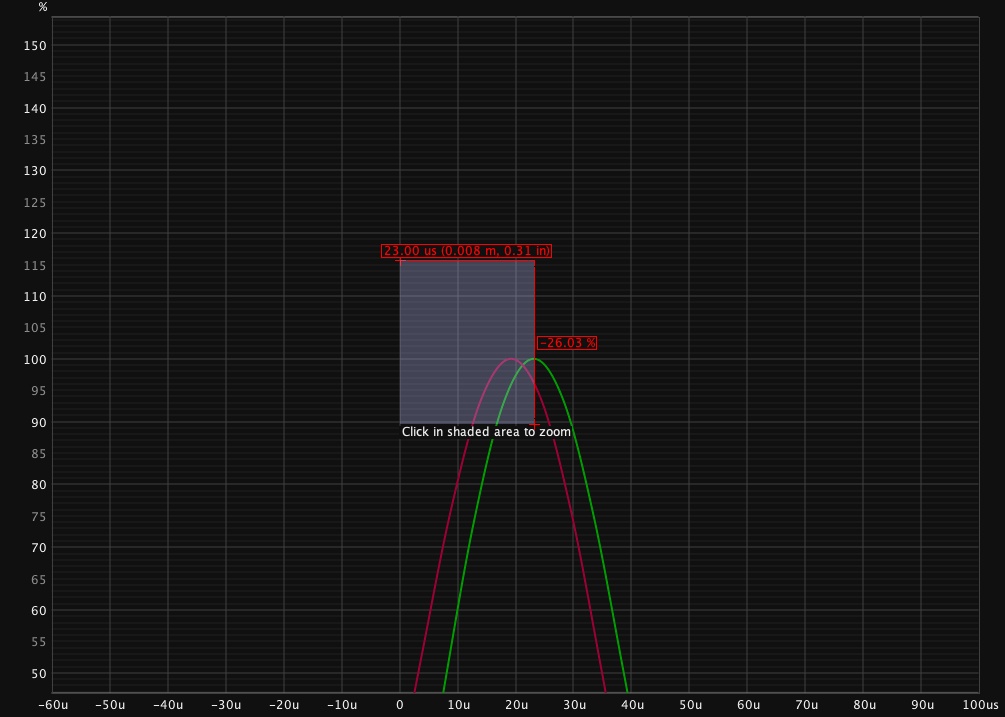
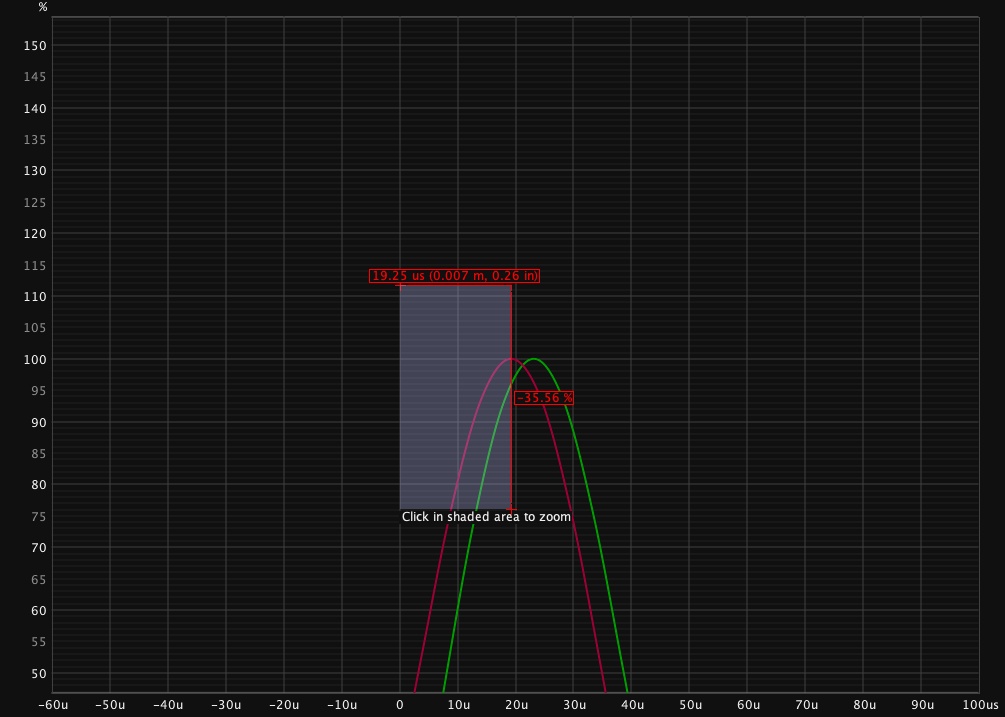
My inversion-filter magnitude curve stays the same when changing the left window from 125ms to 21us, as I’d remembered when setting it up.
The impulse starts rising from the 0-line at 21us, btw.
![]()
When shortening it further, cutting off the positive going impulse, or when shortening the right window, it changes quite visibly.
I’ve got to disclose that I had modified your procedure to facilitate correction of my line-source-full-range-driver-array response in addition to correcting for the room response.
Pic 1 left channel inversion-filter curve with 125ms left window:
Pic 2 left channel inversion-filter curve with 21us left window: