Wondering if you can share what the parametric eq functional forms are.
For example, looking at the “Low Shelf”, it depends on Frequency, Gain, and Q. What is the functional form vs frequency given these three parameters?
Thx.
Wondering if you can share what the parametric eq functional forms are.
For example, looking at the “Low Shelf”, it depends on Frequency, Gain, and Q. What is the functional form vs frequency given these three parameters?
Thx.
If you just play a bit with the parameters, you’ll get a graphical representation of what happens; explains more than a thousand words…
Frequency defines the center frequency of the filter.
Gain defines the level difference between passband (where the filter does nothing) and stopband (where the filter has reached maximum effect).
Q defines the steepness of the filter, a larger number steepening the transition between passband and stopband.
Hope that helps a bit along the way.
Best Regards,
Marin
Yes, understood. That’s what I’ve done so far and I am very close:
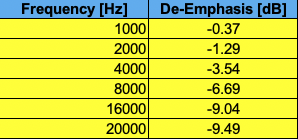
This is the “theoretical de-emphasis” required:
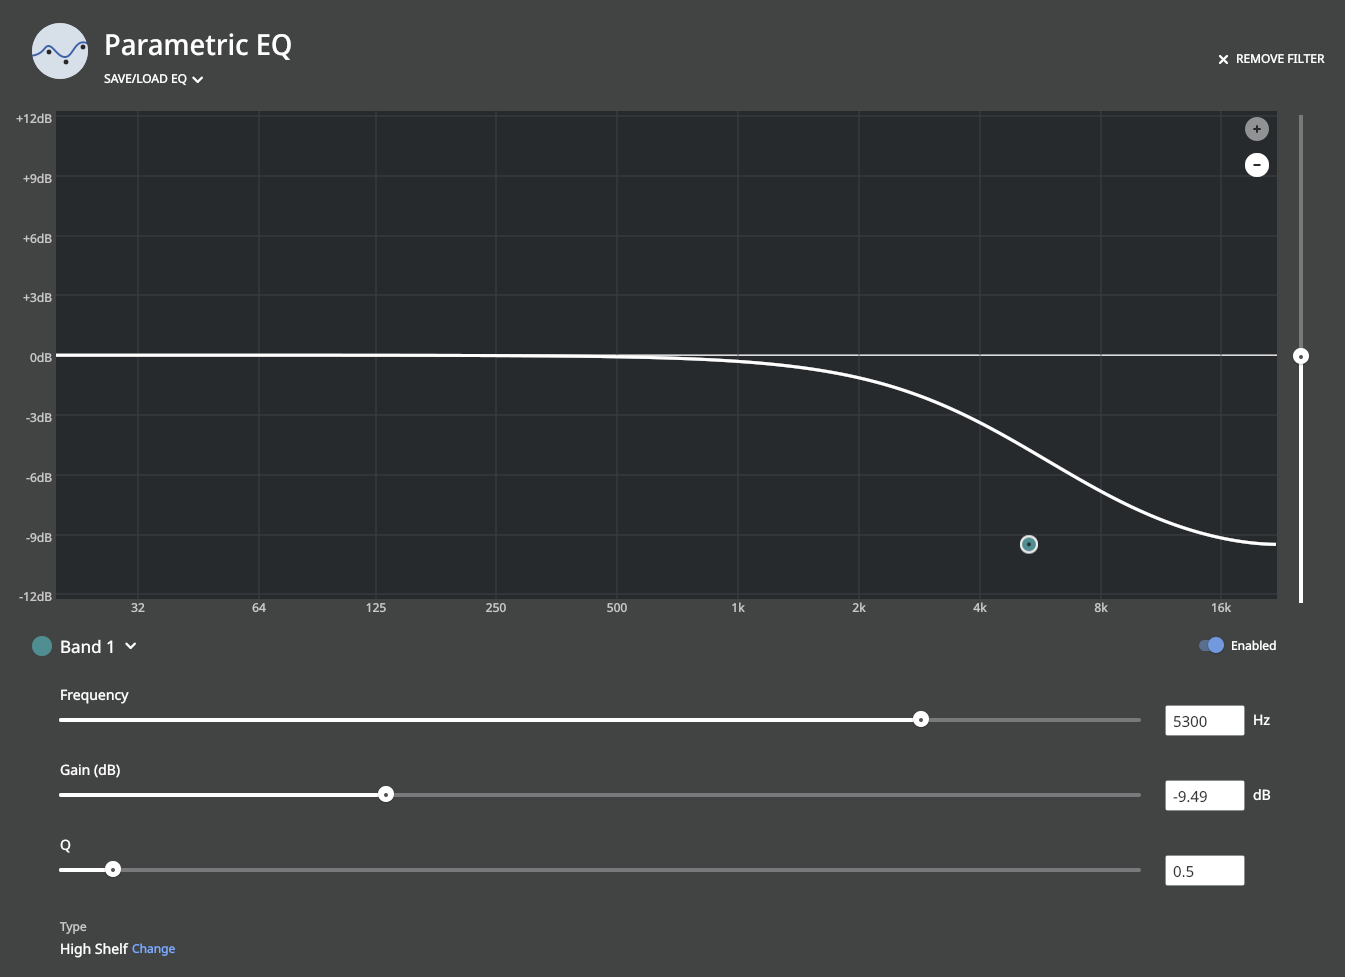
And this is what I mustered by hand in Roon:
which is pretty close (prob close enough) but I could run a minimization routine to match closely approximate the F/G/Q parameters to the theoretical curve above - if I knew the function of F/G/Q used.
I presume the function is something like:
transfer(f) = G*(Tanh((f/F-1)/Q)+1)/2
(but just trying that out shows it is not quite right)
Hey @miguelito
maybe, this’ll get you further:
https://forums.stevehoffman.tv/threads/cd-dat-with-pre-emphasis-how-to-de-emphasize-correctly.88541/
Thx. I saw this, the table above comes from the spreadsheet linked in that article.
However, my question is: what is the functional form of Roon’s High Shelf curve in terms of Frequency, Gain, and Q (the three parameters in Roon) that gives me the shape you see above (the Roon screenshot). If I knew the mathematical shape, I can optimize the parameters F, G, and Q to match the “official” de-emphasis curve given in the table.
If you look at the article you cited, the functional form depends exclusively on two time constants and one dB level - this is different from F, G, and Q - and in all likelihood I cannot match the curve exactly, but I would like to get close by doing a numerical optimization.
Having said all this, the parameters I came up with get me pretty close so this is likely good enough.
I got you, but the maths to transform one into the other are beyond my salary…
Looking at the graph here, I’d go for 5900Hz 10dB and 0.5Q…
I wouldn’t try to do it analytically but would run a numerical optimization to find F, G, Q that best match the de-emphasis curve.
Figured out a way to do it WITHOUT knowing the functional form.
You can do this by:
1- Digitizing the parametric EQ curve in Roon from a screenshot. This means getting dB numbers out of Roon’s plotted curve. You can do this using WebPlotDigitizer.
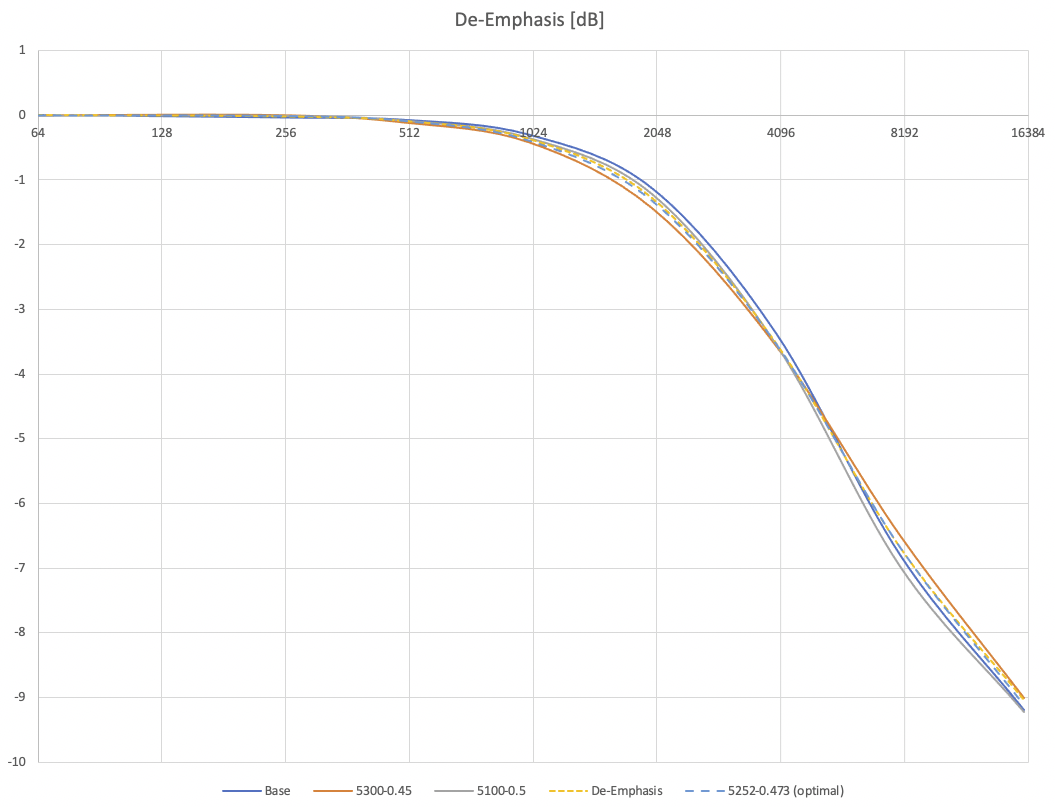
2- Get the above for the base case (F=5300 and Q=0.5 which was close) and then one F shift and one Q shift. (G is the 20KHz value regardless so you don’t have to fit this). With this we get slight variations on the curve around the theoretical de-emphasis curve:
3- Assume the function is linear for small changes, so Taylor expansion gives you:
EQ(f)=EQ0(f) + dEQ/dF(f) * (F-F0) + dEQ/dQ(f) * (Q-Q0)
where f is a set of frequencies sampled (I am using 500, 1K, 2K, 4K, 8K, and 16K). The trick here is you can estimate the partial derivatives from the small variations you did above.
4- Define ChiSq = Sum[(EQ(f)-DeEmphasis(f))^2, f] (ie sum the square diffs over all samples)
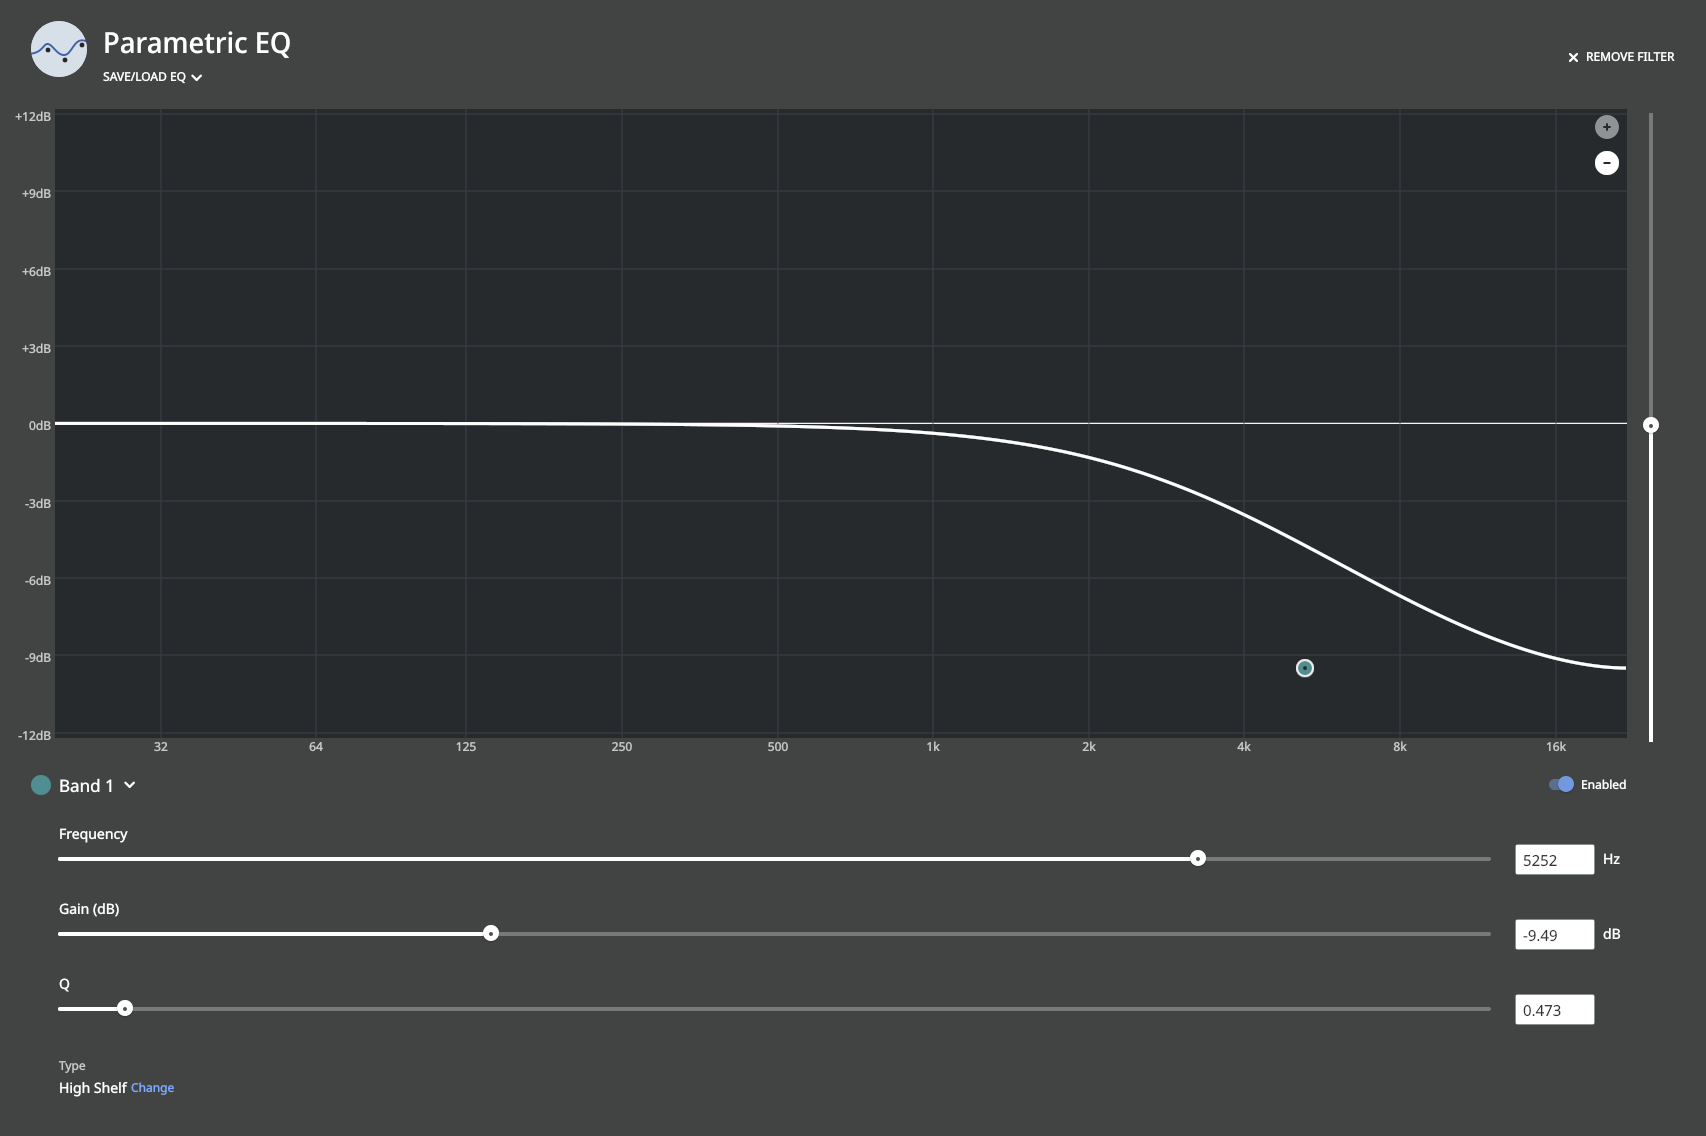
5- Minimize ChiSq - this can be done analytically in this case. The result is a curve that closely matches the theoretical de-emphasis curve. The optimal values for the High Shelf filter in Roon are:
F = 5252 Hz
G = -9.49 dB
Q = 0.473
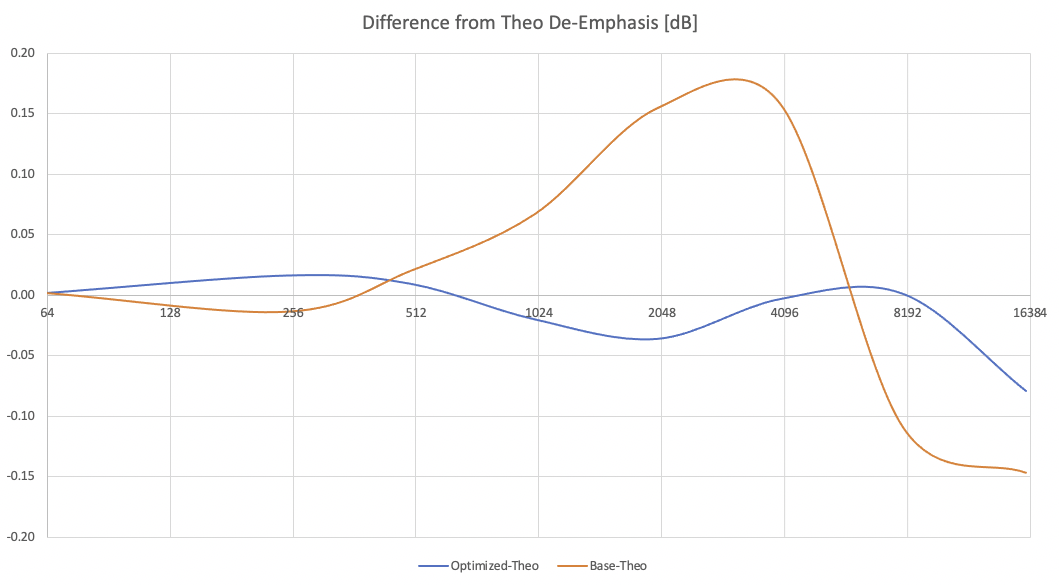
Note that the curves will not exactly match since they are different functional forms and it is generally not the case that two functional forms cover the same functional space.
And this is the deviation from the theoretical (exact) de-emphasis curve:
Why a de-emphasis curve? Because it corrects pre-emphasis applied to many early CD pressings.
See: http://archimago.blogspot.com/2020/09/how-to-cd-pre-emphasis-and-dealing-with.html
Do you mean there are CD drives that do not automatically de-emphasize a CD that is emphasis coded? This should automatically happen when the CD is read. It is part of the specs for CD players.
Nope. Only for analog output. Emphasis added—pun intended.
For ripping, optical drives do not apply digital de-emphasis. Bar none. Furthermore, many optical drives and ripping software are not sufficiently equipped to detect and even flag pre-emphasis in both subcode and table of contents.
AJ
I really enjoyed this thread, the history, and the approach to getting the right filter parameters. As far as I know, I don’t have any CDs that need this, but I have a few that I’m suspicious about. Of course, with Tidal, there are often more recent versions/masterings that I can listen to.
Thanks to you and @miguelito to raise this issue. I have a number of CDs that I can remember that my Sony CD player late 80’ indicated that de-emphasis was used while listening. I used iTunes to rip them to Alac lossless. Are those de-emphasized?
Some CD players do for sure. I don’t know if modern CD players do. I don’t think Roon does de-emphasis based on the audio data.
However, if you rip with a perfect ripper, no de-emphasis is applied to my knowledge. Some rippers like iTunes do apply this correction.
Practically, the parameters given here give you a de-emphasis filter you can try.
My understanding from the archimago article is iTunes does de-emphasis when you rip.
Alas, this means it is not a perfect rip!
AJ. Do you know how I could see the pre-emphasis flag in a ripped file? Ripped with XLD, should be bit perfect
I will check this. Thanks!
Hi Miguel…
I enjoyed seeing you and your NYC audio system on Steve’s YouTube channel.
Cannot be done on a ripped file. Not definitively, anyway.
Pre-emphasis flags in subcode or table of contents are carried over S/PDIF from transport to DAC. But no flags are incorporated in ripped files audio data – only in metadata from some equipped drives and programs. dBpoweramp for table of contents detection. CUETools for both subcode and table of contents.
If you have an existing CD rip that may contain pre-emphasis, your best bet may be to run DR analysis, then compare to entries in the DR Database. Not exactly scientific, but you may be able to confirm that your rip contains pre-emphasis.
AJ
A slightly more careful and high-sample point calculation yields:
F = 5268 Hz
G = -9.49 dB
Q = 0.472
and the discrepancy plot:
Notice that there’s “noise” in the data (eg oscillations around 400Hz). This is caused by the crude - albeit quite powerful - method of capturing the data from a screenshot (I have no way to get Roon’s filter values out other than a screenshot and using WebPlotDigitizer to estimate numerical values). So the real discrepancy is a smoother rolling average.
Also note that the increased discrepancies around 15KHz and 20KHz are still very small in relative value: 0.7dB/9dB which is less than 1% discrepancy
A brief recap on how I am going to deal with pre-emphasis:
The fool-proof way is to re-rip and look at the resulting cue sheet. I will not do this as I’ve already ripped thousands of my CDs.
The next most accurate method for CDs you’ve already ripped is to capture the first track from a streaming service (Qobuz or TIDAL), calc the frequency spectrum (eg with MusicScope on the mac) and compare that to your rip’s spectrum. Normalize by considering the difference around 200Hz, and if the 16KHz region of the spectrum is roughly 9dB down in the capture vs your rip, then your rip has pre-emphasis. This assumes of course that streaming services dealt with pre-emphasis to begin with.
Finally the simplest method - and the least accurate one - is to play your rip and compare the sound to the streamed version. If your rip sounds bright and harsh in comparison, then you probably want to try a de-emphasized version. This again assumes that the streaming service album is properly de-emphasized in the digital master in the first place. You can use the Roon high-shelf filter I described above to toggle and check.
As a side note, there’s one CD that I always thought was bright and harsh - Vivaldi’s Stabat Matter feat Andreas Scholl (Harmonia Mundi). The streaming version sounds the same as my rip, but if in Roon I engage the de-emphasis filter, it sounds a lot more natural to my ears. This makes me suspect that this release has not been properly de-emphasized in the streaming service case.