Figured out a way to do it WITHOUT knowing the functional form.
You can do this by:
1- Digitizing the parametric EQ curve in Roon from a screenshot. This means getting dB numbers out of Roon’s plotted curve. You can do this using WebPlotDigitizer.
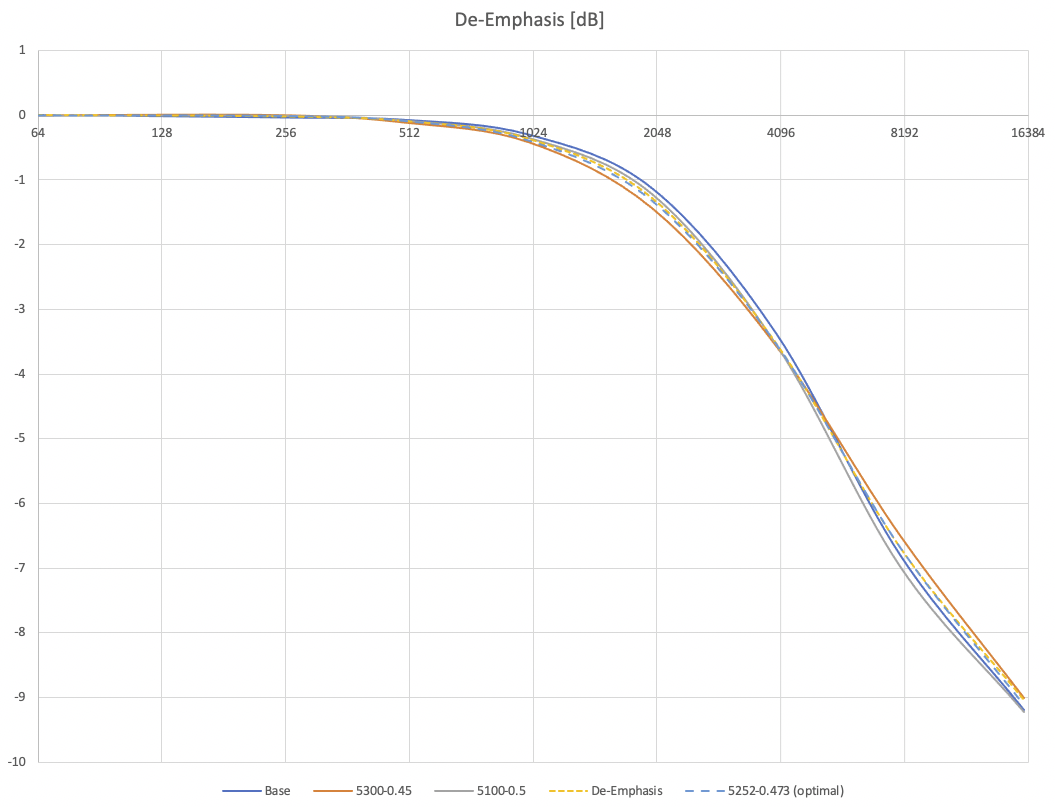
2- Get the above for the base case (F=5300 and Q=0.5 which was close) and then one F shift and one Q shift. (G is the 20KHz value regardless so you don’t have to fit this). With this we get slight variations on the curve around the theoretical de-emphasis curve:
3- Assume the function is linear for small changes, so Taylor expansion gives you:
EQ(f)=EQ0(f) + dEQ/dF(f) * (F-F0) + dEQ/dQ(f) * (Q-Q0)
where f is a set of frequencies sampled (I am using 500, 1K, 2K, 4K, 8K, and 16K). The trick here is you can estimate the partial derivatives from the small variations you did above.
4- Define ChiSq = Sum[(EQ(f)-DeEmphasis(f))^2, f] (ie sum the square diffs over all samples)
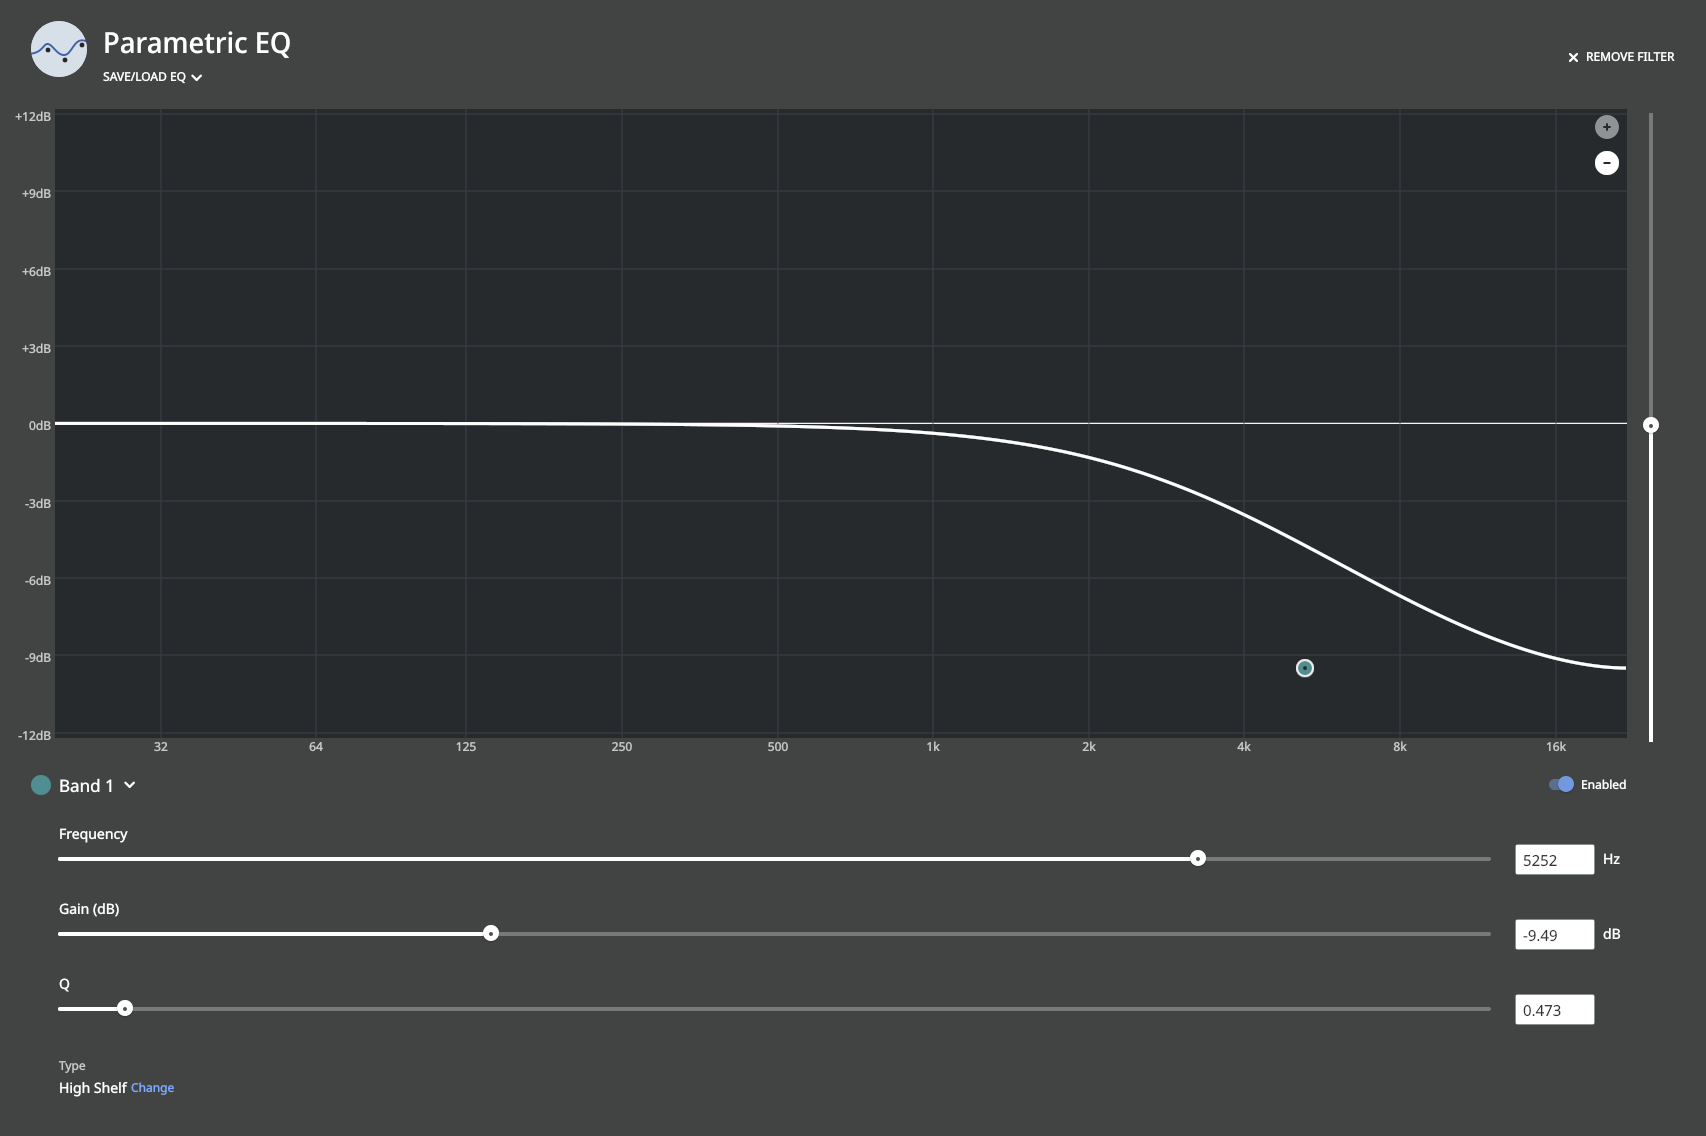
5- Minimize ChiSq - this can be done analytically in this case. The result is a curve that closely matches the theoretical de-emphasis curve. The optimal values for the High Shelf filter in Roon are:
F = 5252 Hz
G = -9.49 dB
Q = 0.473
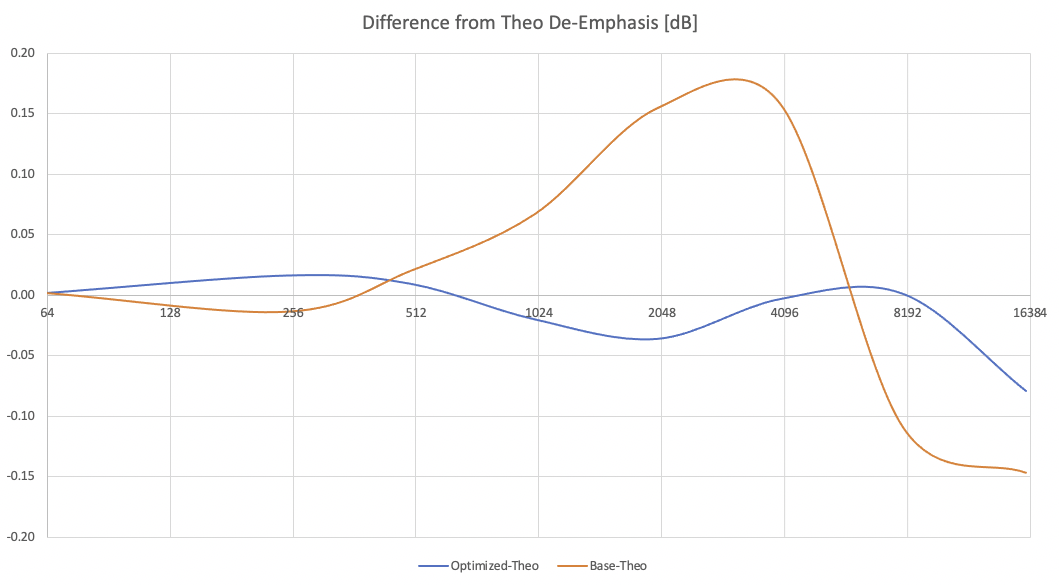
Note that the curves will not exactly match since they are different functional forms and it is generally not the case that two functional forms cover the same functional space.
And this is the deviation from the theoretical (exact) de-emphasis curve: