Thanks for the feedback. Little above my pay grade, I’m afraid. I’m a simple man, merely responding to roon’s request for EA build RAM usage. Appreciate, it, though. Have a good day!
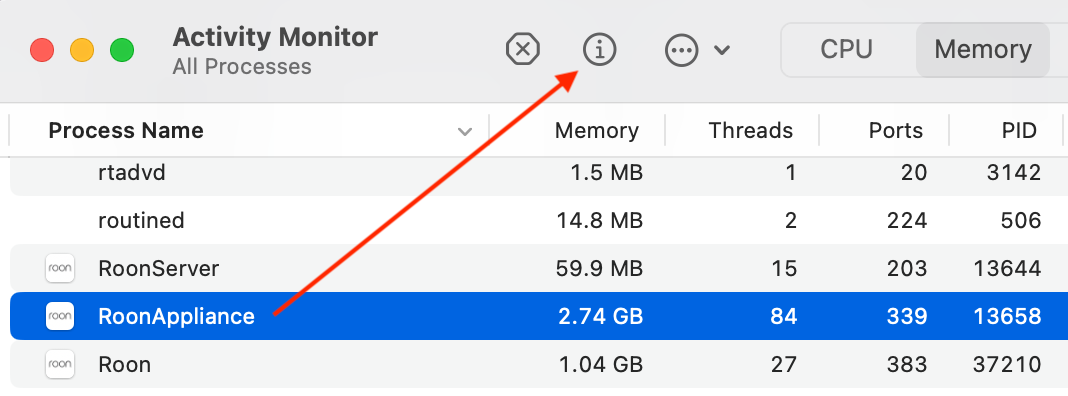
Quick update, a full day later… The RAM usage is now routinely hovering around three gigabytes for each of the two processes. Quite an increase. Is this still within normal usage parameters? Thanks!
After several edits, this is turning into an interesting (silly?) exercise of making a real number fit into a back of the napkin calculation, comparing apples and pineapples.
Edit (2026-04-04): don’t try and calculate this way because it doesn’t reflect the current state of memory growing every day
Try taking the log of the sum of items in your music library, then multiply by 0.75
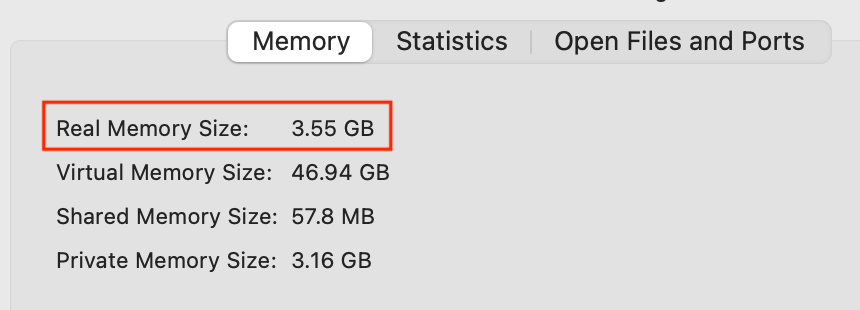
3. Compare Mac OS stats with Roon library memory estimate
Real memory size vs proxy calculation from step two above. Memory use fluctuates and it’s in relation to the size of your music library and server management.
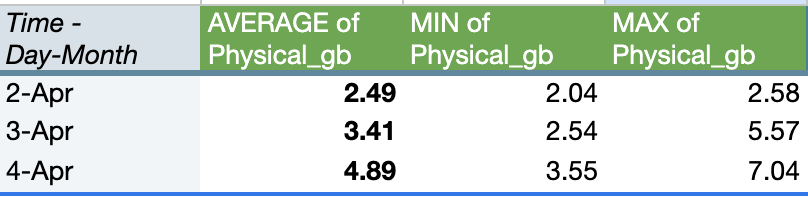
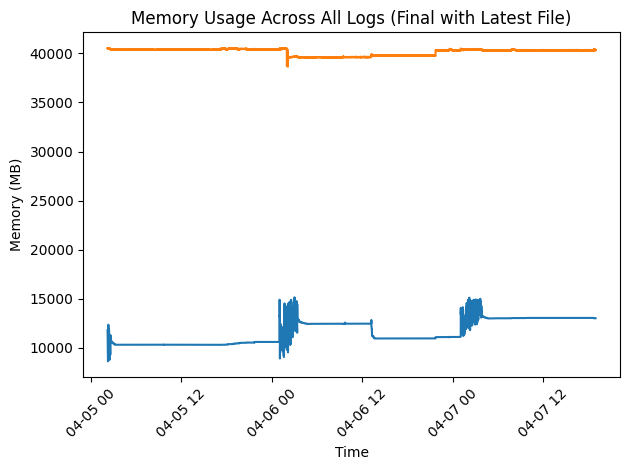
The math above assumed that memory could be estimated to fall within a predictable range. For example, 3.5 GB +/- 0.25. But that sort of approximation doesn’t fit with the way my Roon’s memory grows daily as you can see in the screenshot below.
I’m gonna leave Roon alone for a week - no restarts, no music playing - starting Monday and see what the memory size looks on Saturday. Maybe it will have settled to a normal range when idling.
As you experiment with this, if you don’t mind, feel free to ping me with updates and results. We are starting to slowly land memory related perf improvements. Some of those changes are reducing the number of allocations required for certain operations which should hopefully led to less memory/gc pressure and freeing up some CPU cycles.
I’ll double check when I am home, but yesterday I saw memory in use upto 7gb with a 40k track library (not my full local library nor with Qobuz). I discounted this initially as I was importing some local files but think it stayed up there. This is on a clean install and database with nothing to clean-up.
I’ve stopped looking at memory use TBH, with 32gb it’s there to be used. Just as long as things are stable and managed correctly.
Running DietPi with Roon server installed.
Edit: my mistake. I had left Qobuz logged in but disabled with 145k tracks still on the db
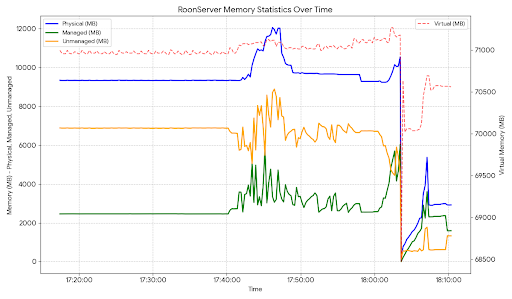
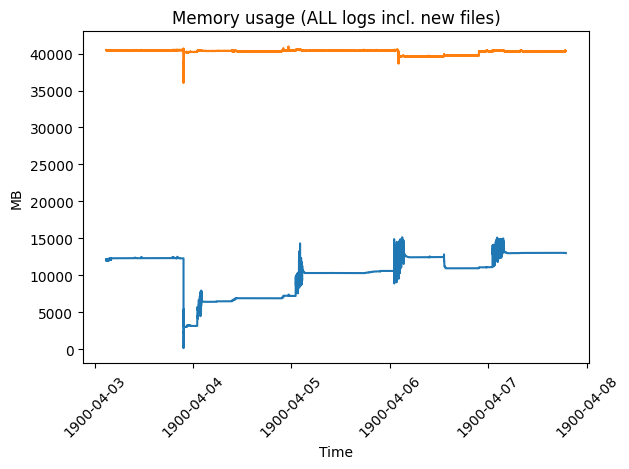
Access the log files, upload them to an AI assistant of your choice. Ask the AI to extract the memory logs, compile them in order of date/time and plot a graph.
Here is a 1 hour example (the drop off at just after 18:00 was me restarting Roon). Dietpi only keeps an hours logs by default, but Rock should keep continuous logs (20 usually and the longer used, the more data points).
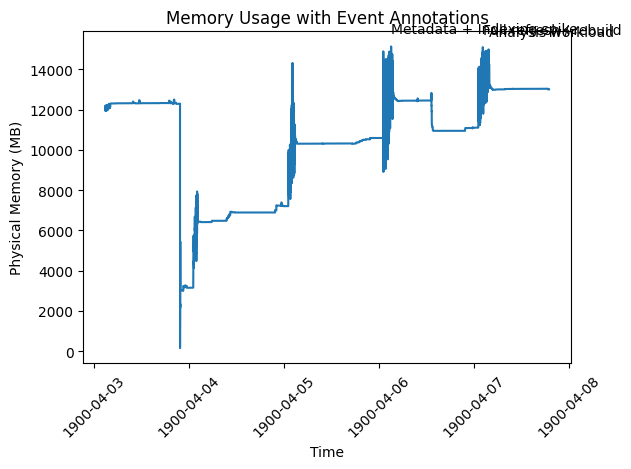
So this is a NUC7i7DNK same board as a RevB Nucleus+, but with 16GB RAM and a 250GB NVME SSD.
Library size is 106,867 tracks, 7,924 albums from 3,838 artists and 538 composers.
With the first major spike on Apr 5, at ~14–15 GB, am I
Running out of RAM for ROCK to operate?
Need to increase RAM to 32GB (2x16GB)
Or ROCK is just using the available memory during the schedule update window, and once complete memory is returned, is stable and Roon is available for use.
Just put my latest Log files back through ChatGPT and you can see last night’s ‘Scheduled activity’ between 2am and 6am, with circa 7-8GB used, and then released, as there was a restart following the application of the latest build B1647.
I also restarted Roon Server yesterday morning, as I was having an issue with a Chromecast Audio endpoint, which had disappeared again.
Memory usage prior to that was circa 5GB following the scheduled activity.
Will repeat this for the new B1647 release, to see if there is any difference on my ROCK server and with my Library.
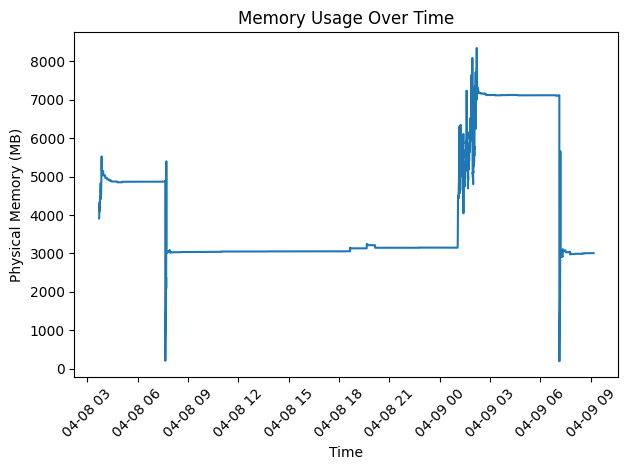
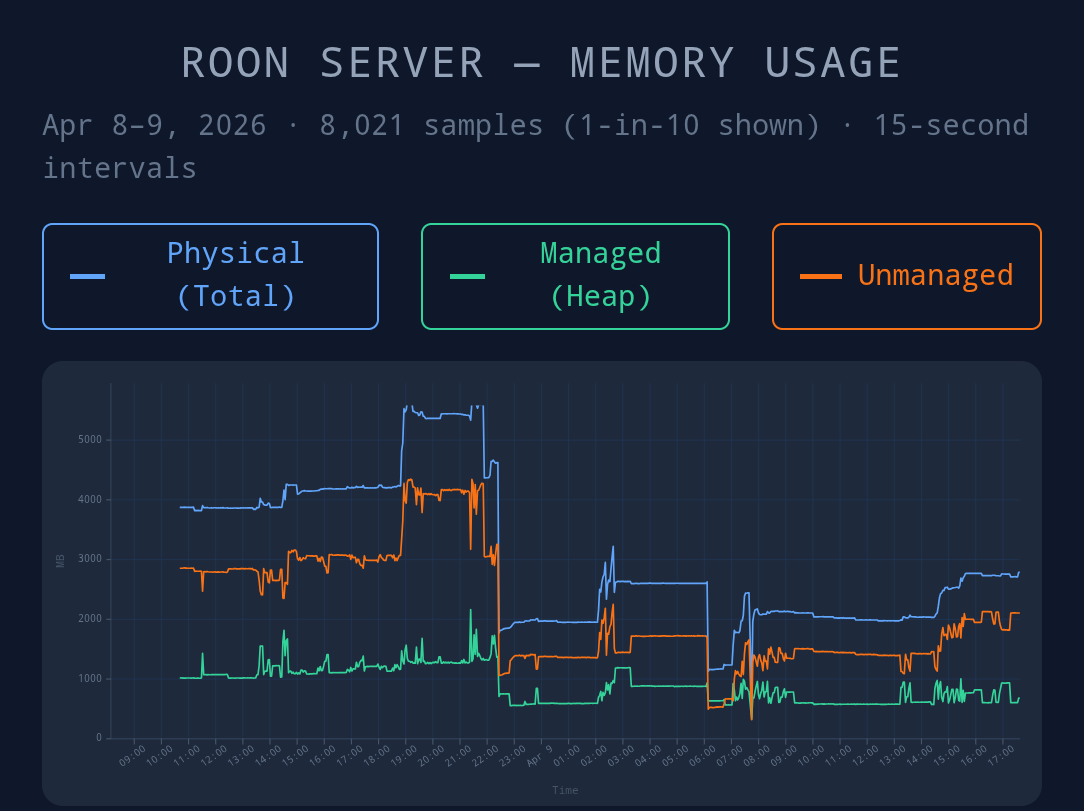
From yesterday through to today I’ve compiled a chart from 8021 data points. I’m seeing a general improvement with this latest EA update. Came home to see only 3.3gb in use after adding several albums to my local library. This action did see a spike prior to the update.
• 2026-04-08 22:24:03: [REBOOT & UPDATE] RoonServer starts using v2.65 (build 1645) earlyaccess.
• 2026-04-09 06:06:41: [REBOOT & UPDATE] RoonServer starts using v2.65 (build 1647) earlyaccess.
• 2026-04-09 07:41:12: [MANUAL RESTART] RoonServer restarts again on build 1647.
• 2026-04-09 07:44:00: [MANUAL RESTART] A final rapid restart on build 1647.
The next issue I need to look at is the Roon Ready implementation on my FiiO R7 that has recently started crashing. Seems to coincide with using the last couple of EA builds. Got worse with the last EA build. Just crashed now in B1647.
Library size on this server is 43646 local tracks.
For context there are 1294 unidentified tracks (96 albums). Some of these albums should have been identified, because manually some are identified immediately.
Massive Metadata Syncing
The logs from the early hours of April 10th (around 01:17 AM to 01:30 AM) show Roon making huge batch requests to metadataserver.roonlabs.net. It is downloading updated metadata, images, and track information for thousands of items in your library.
Library Sorting & “Dirty” Item Rebuilds
As Roon downloads this new metadata, it flags parts of your database as “dirty” (meaning out of date). The logs show Roon constantly re-sorting albums and genres item-by-item in the background (e.g., LibraryAlbum:65 dirty and LibraryGenre:45 dirty items).
Memory Caching Behavior
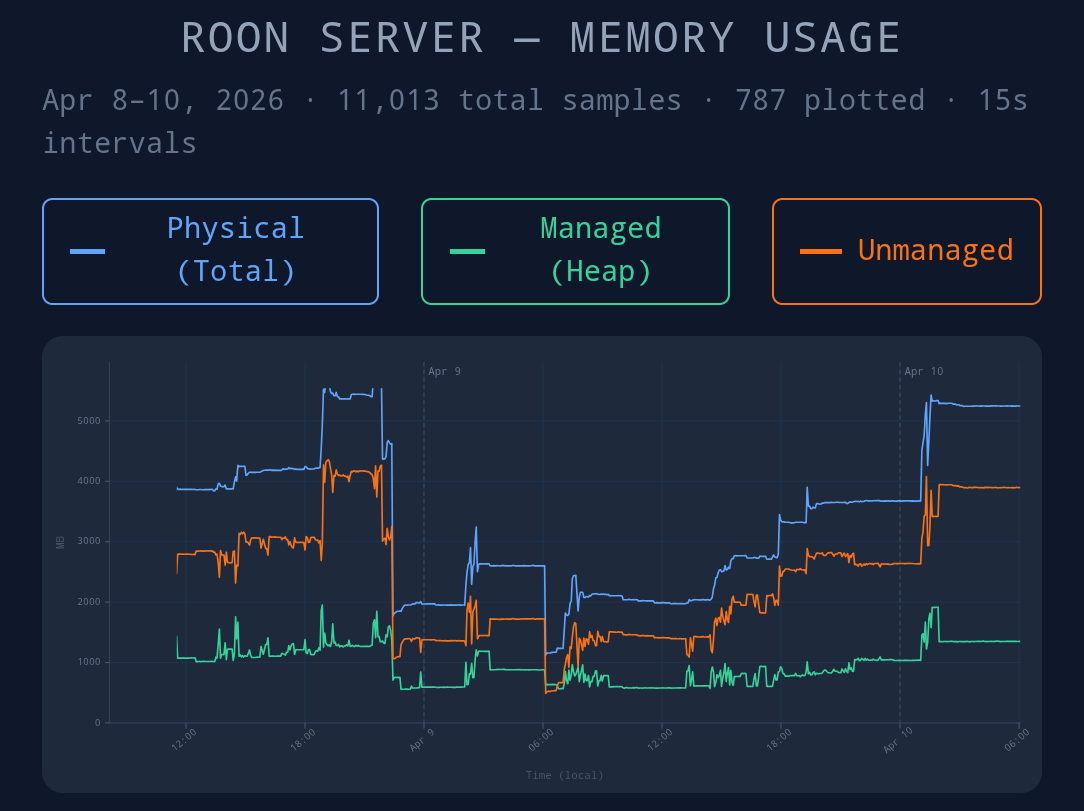
To process these library updates quickly without wearing out your hard drive, Roon caches the database in your system’s RAM. Your memory stats at 06:04 AM show:
Physical Memory: 5248 MB
Managed Memory: 1349 MB
Unmanaged Memory: 3899 MB
The massive ~3.9 GB of “Unmanaged Memory” indicates that Roon is intentionally holding onto large blocks of background database operations and downloaded metadata images/cache in RAM.
Conclusion
When you aren’t using Roon to play music, it takes advantage of the downtime to sync with the cloud, re-index your 43,646 tracks, and cache the results. Because Roon is designed to be as fast as possible when you do open the app to search or browse, it will aggressively use whatever free RAM is available to hold onto this background data rather than letting it go immediately.
So this indicates the background work schedule is kicking in at 1am. It should end at 5am and in my eye, needs to release (GC) used memory.
It’s now 6:48am and 5.4gb is still used.
This gives me concerns for folks running a similar library size on a Nucleus One shipped with 4gb of memory. Multiple crashes would occur. Or is Roon clever to know how much RAM is available.
As it stands Roon shows no signs of a GC. I won’t manually restart things, I will use Roon Arc whilst at work and will check again in 10 hours what’s happened.