Jump down to Memory under pressure: your experiences with Roon garbage collection - #15 by Dadoo for my analysis and takeaways.
Background
I’ve been a Roon customer for less than a year and I enjoy using it daily. It’s become clear to me that Roon is a sophisticated and complicated system that many users are shielded from by design. When issues have come up, the volunteer moderators and support team have been very responsive and helpful.
I’m sharing some technical observations with the Roon community in order to learn from your experiences with the following and how to deal with it. To be clear, I am not describing a memory leak. I am describing poorly performing garbage collection.
Situation
Interacting with Roon feels increasingly sluggish over time and when it lags, music playback and streaming to audio devices stops intermittently. The following usually happens because network communication failed while the Roon server froze during garbage collection.
-
Music playback stops
-
Audio devices disappear from the Roon UI
- After several seconds, devices are visible again and music can be resumed at the last played position
-
Syncing metadata to Roonlabs and Qobuz (e.g., adding an album to library) fail intermittently or take many seconds to see visual feedback in the Roon UI that syncing was successful
The workaround has been to restart Roon when I notice things slowing down.
Observations
Over the past couple of months, I’ve noticed that Roon feels snappier after updating to the latest version. I started paying close attention to the log files to determine if it was the result of software improvements (e.g., .NET v10) or the magical reboot/restart that fixes things 99% of the time.
Sifting through logs and trying to correlate events with what I experienced is difficult, so I now use Grafana to visualize events over time, and patterns are emerging.
-
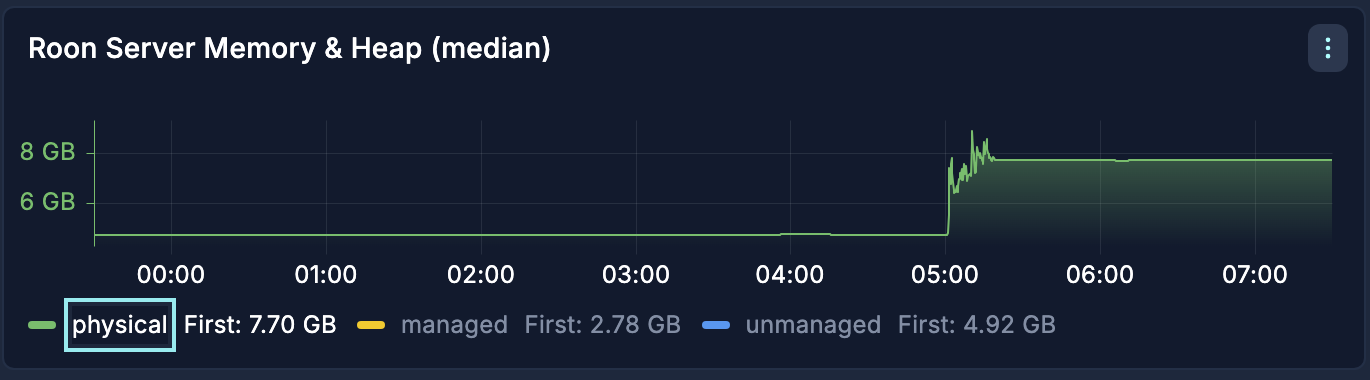
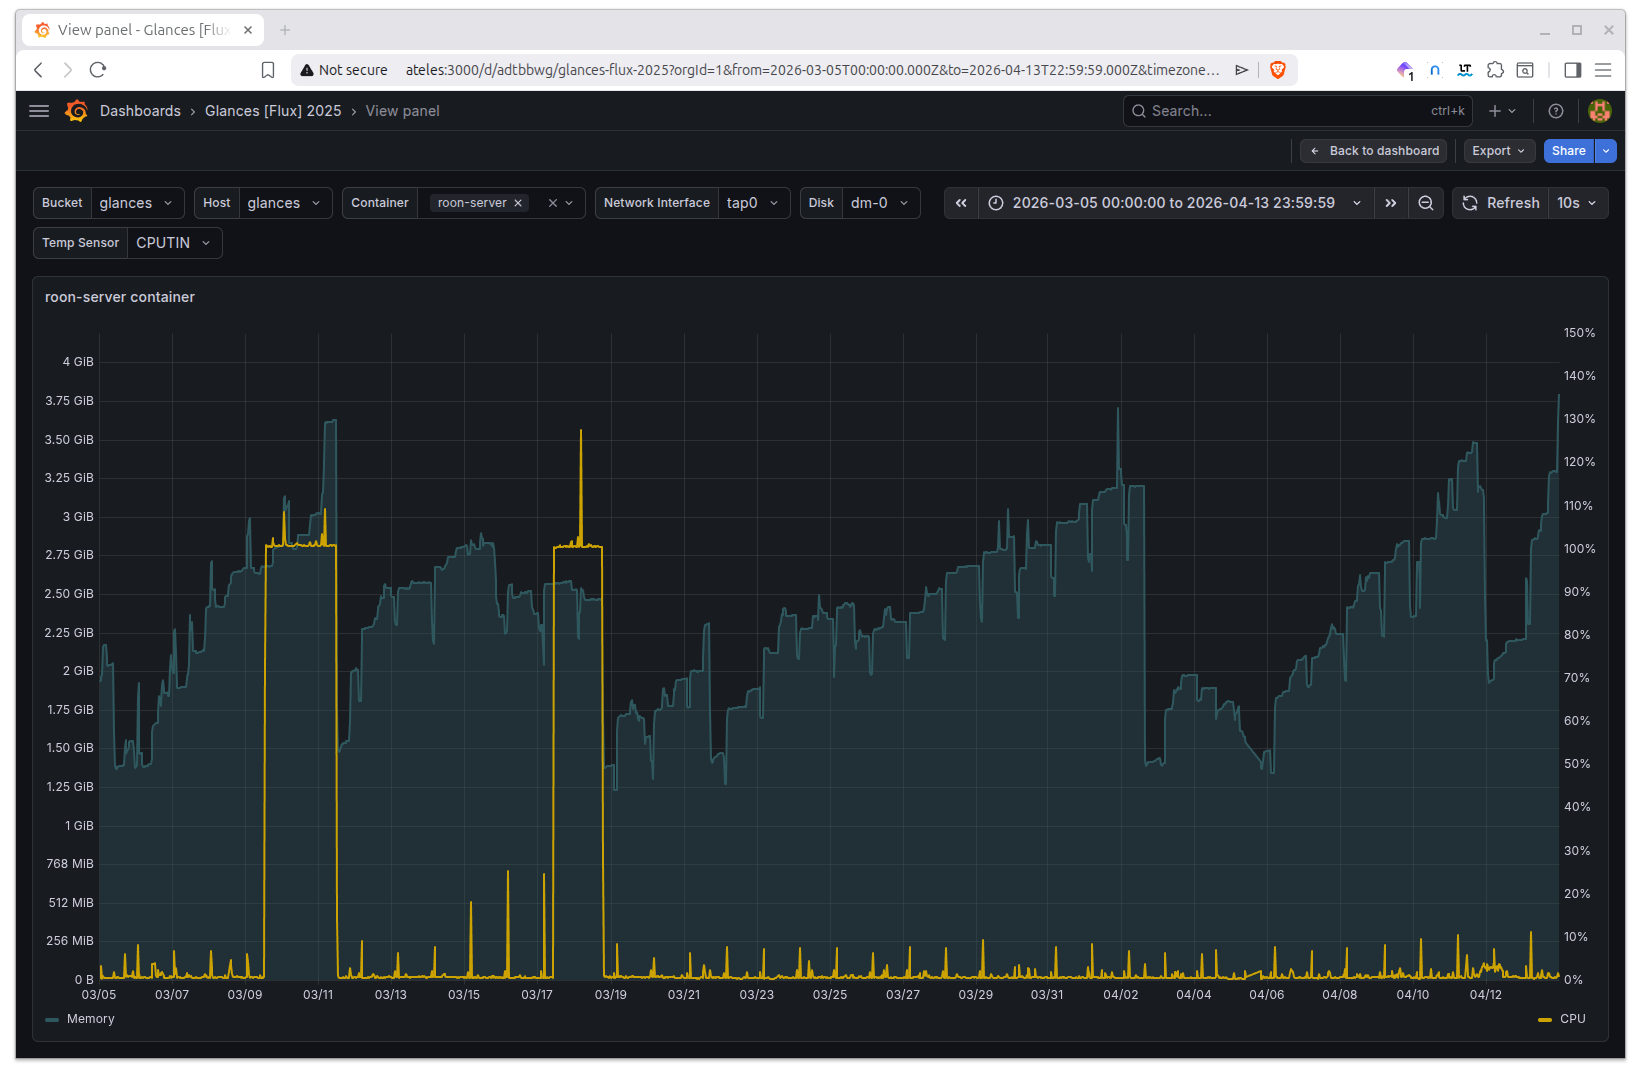
Physical allocated memory expands and contracts within an acceptable range with no observed out of memory conditions.
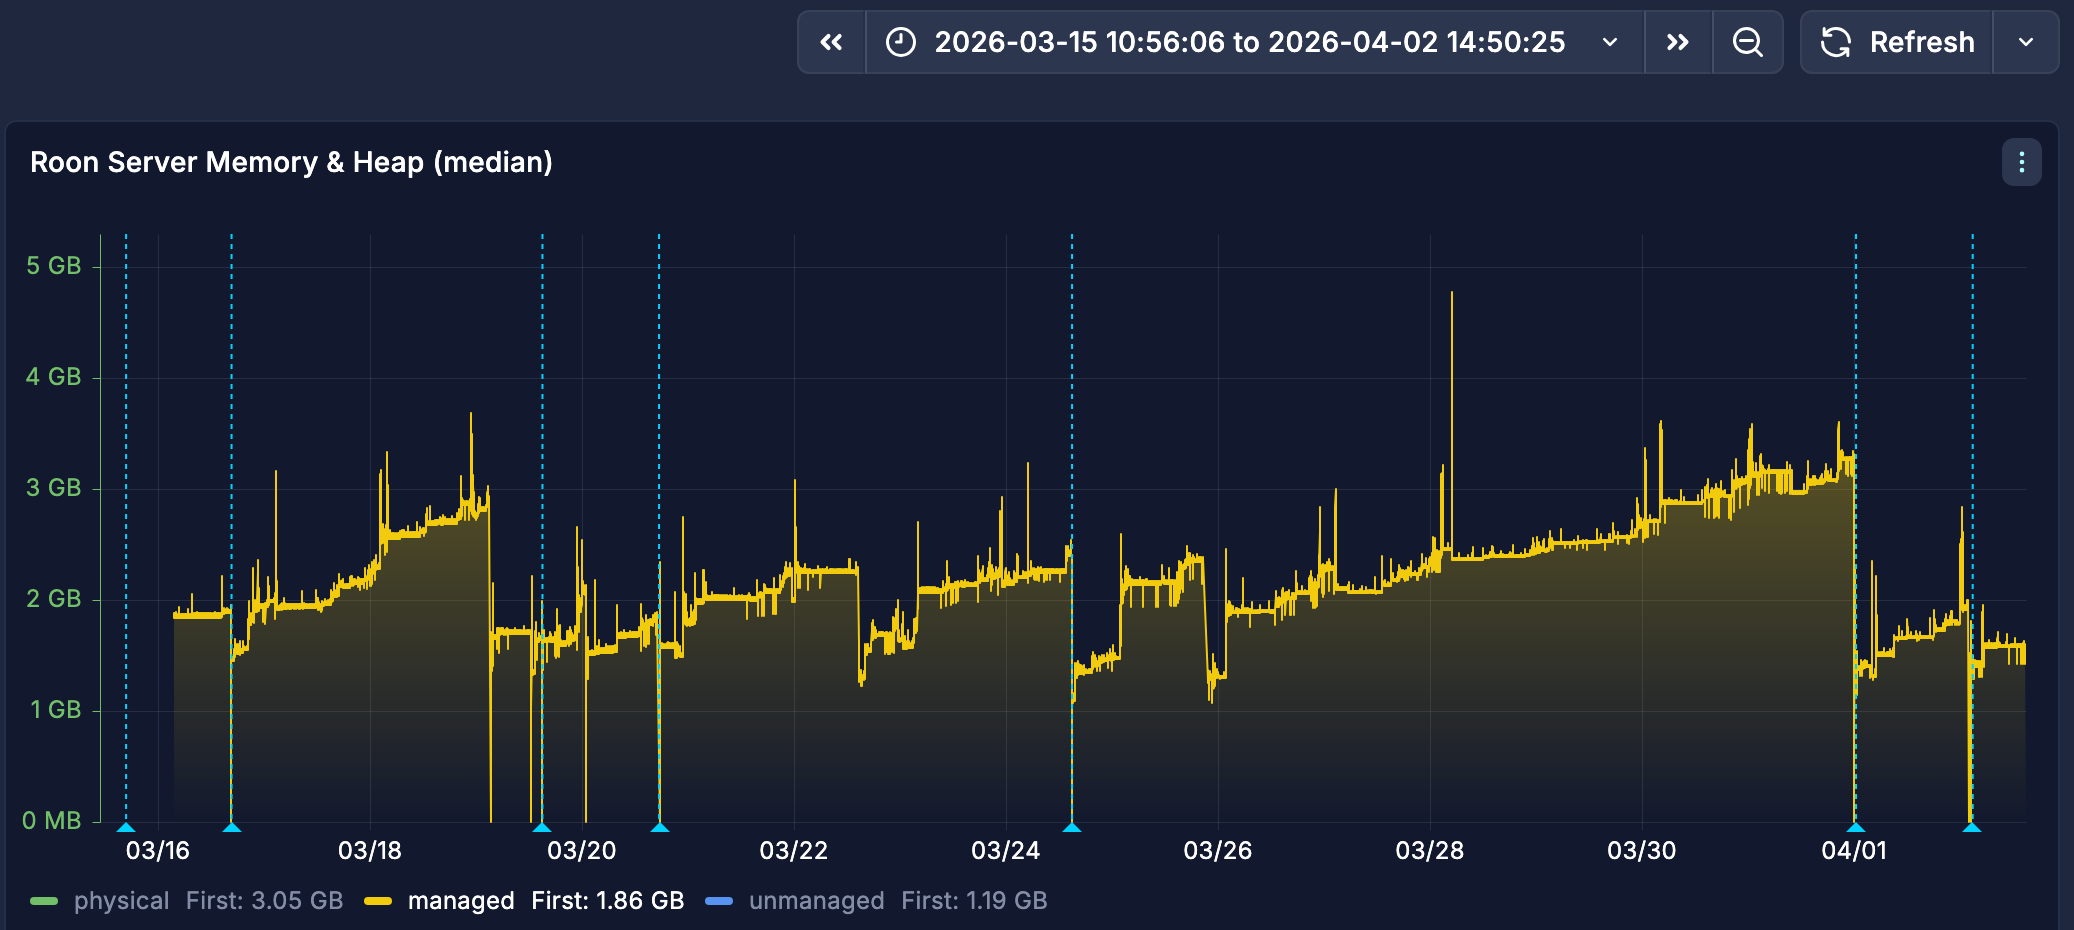
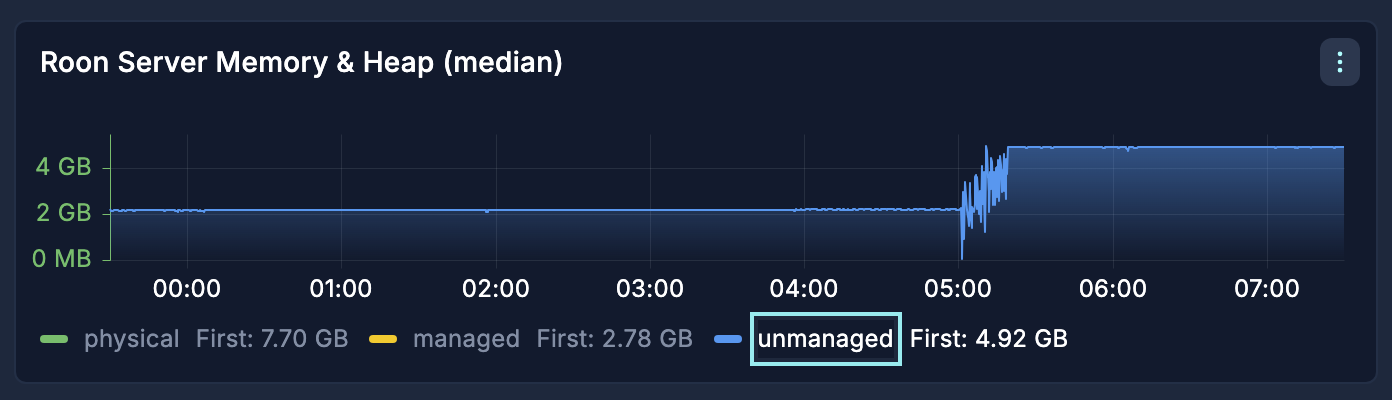
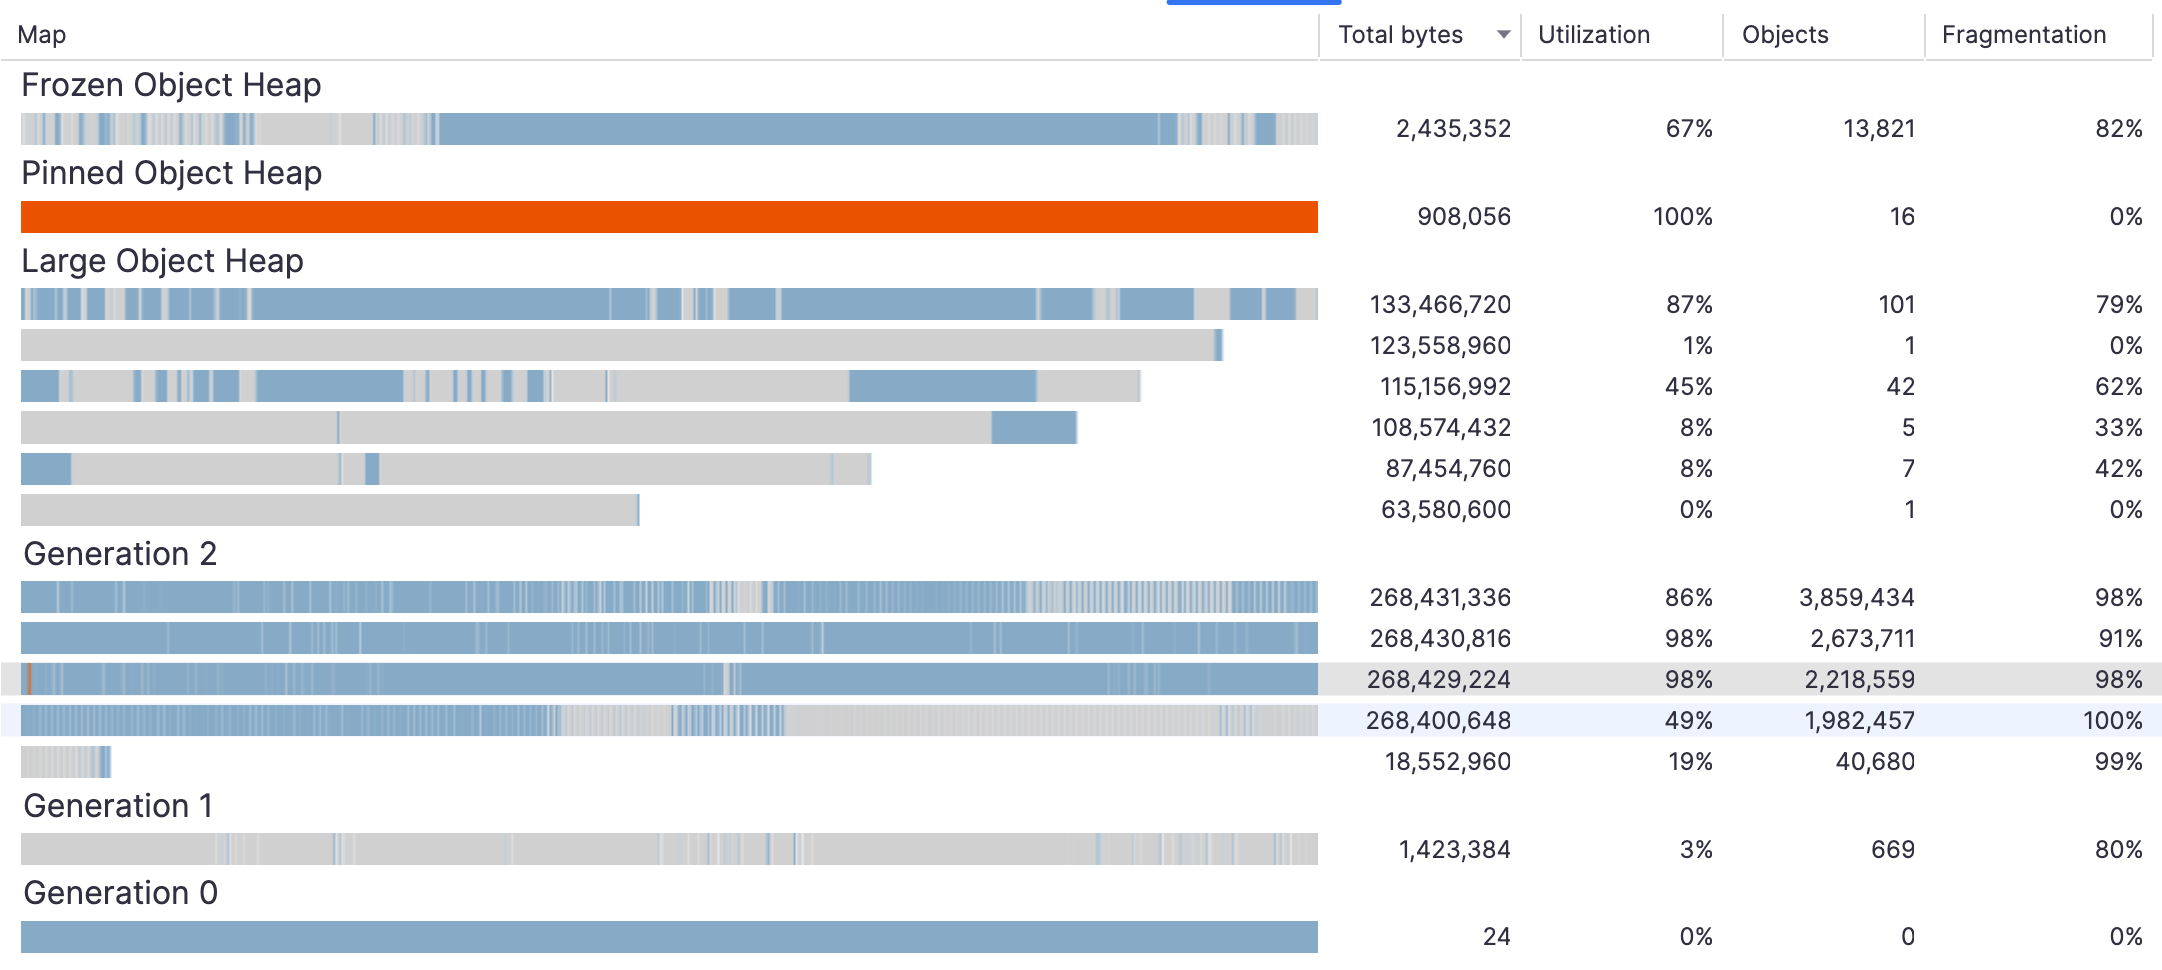
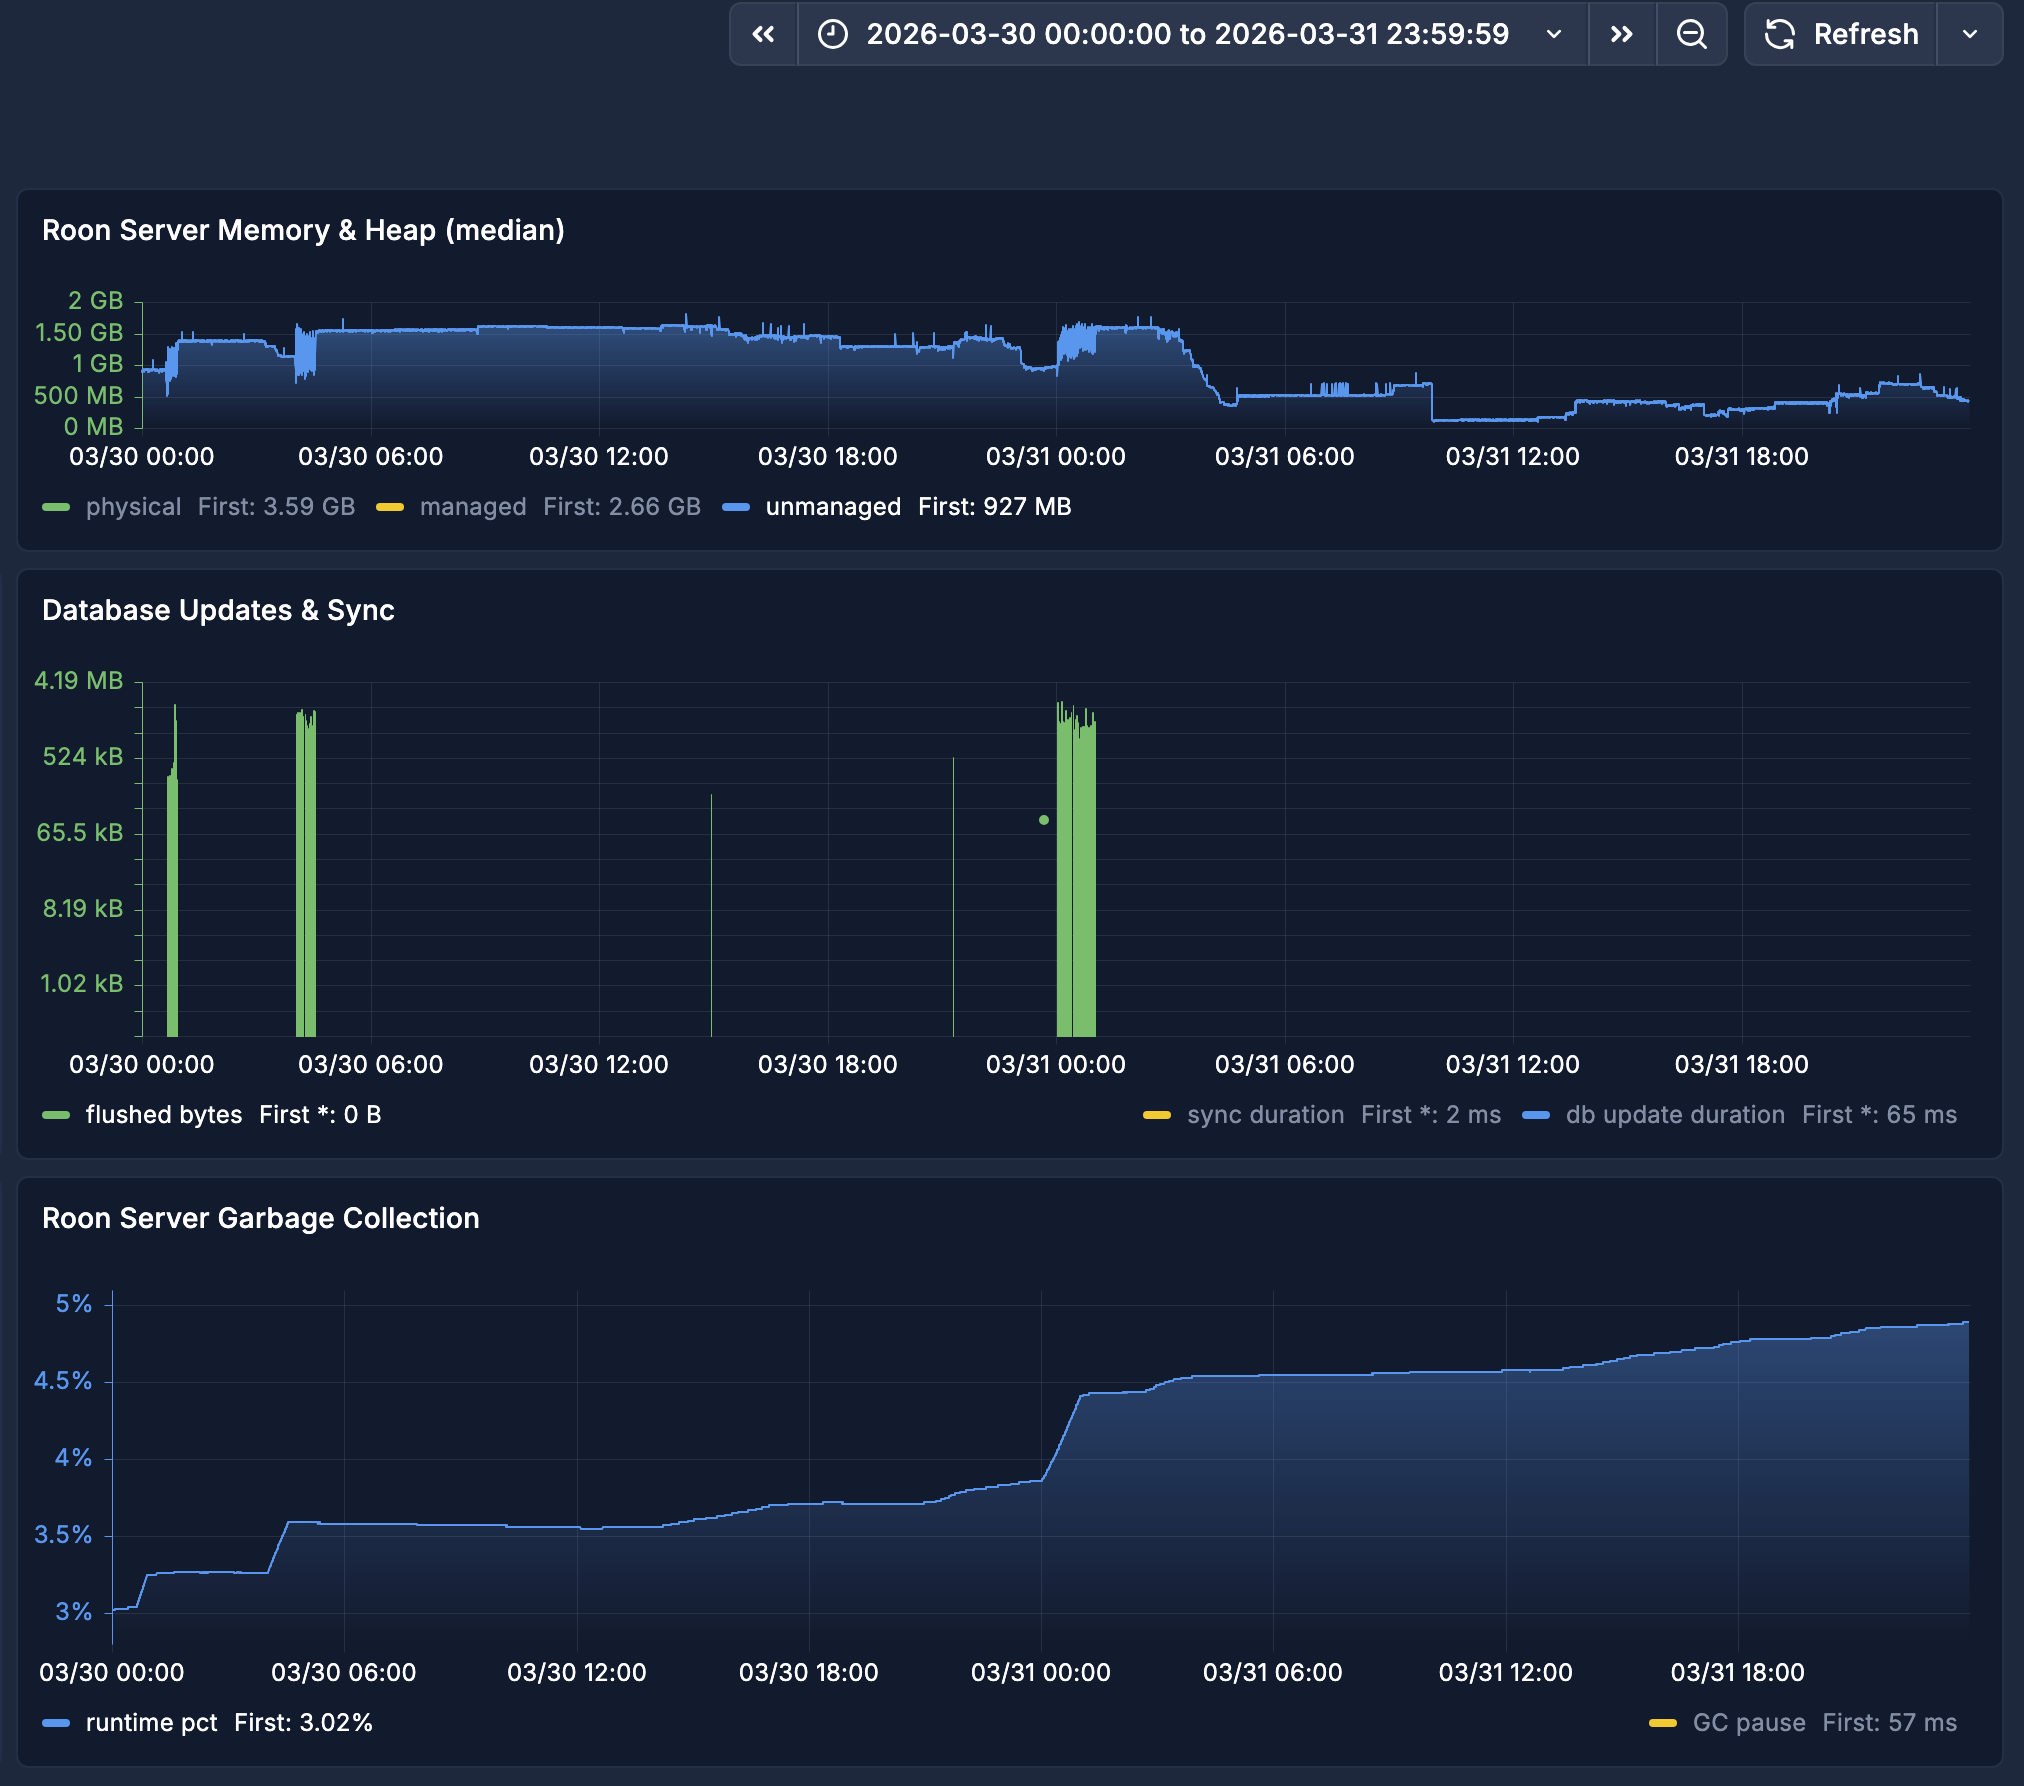
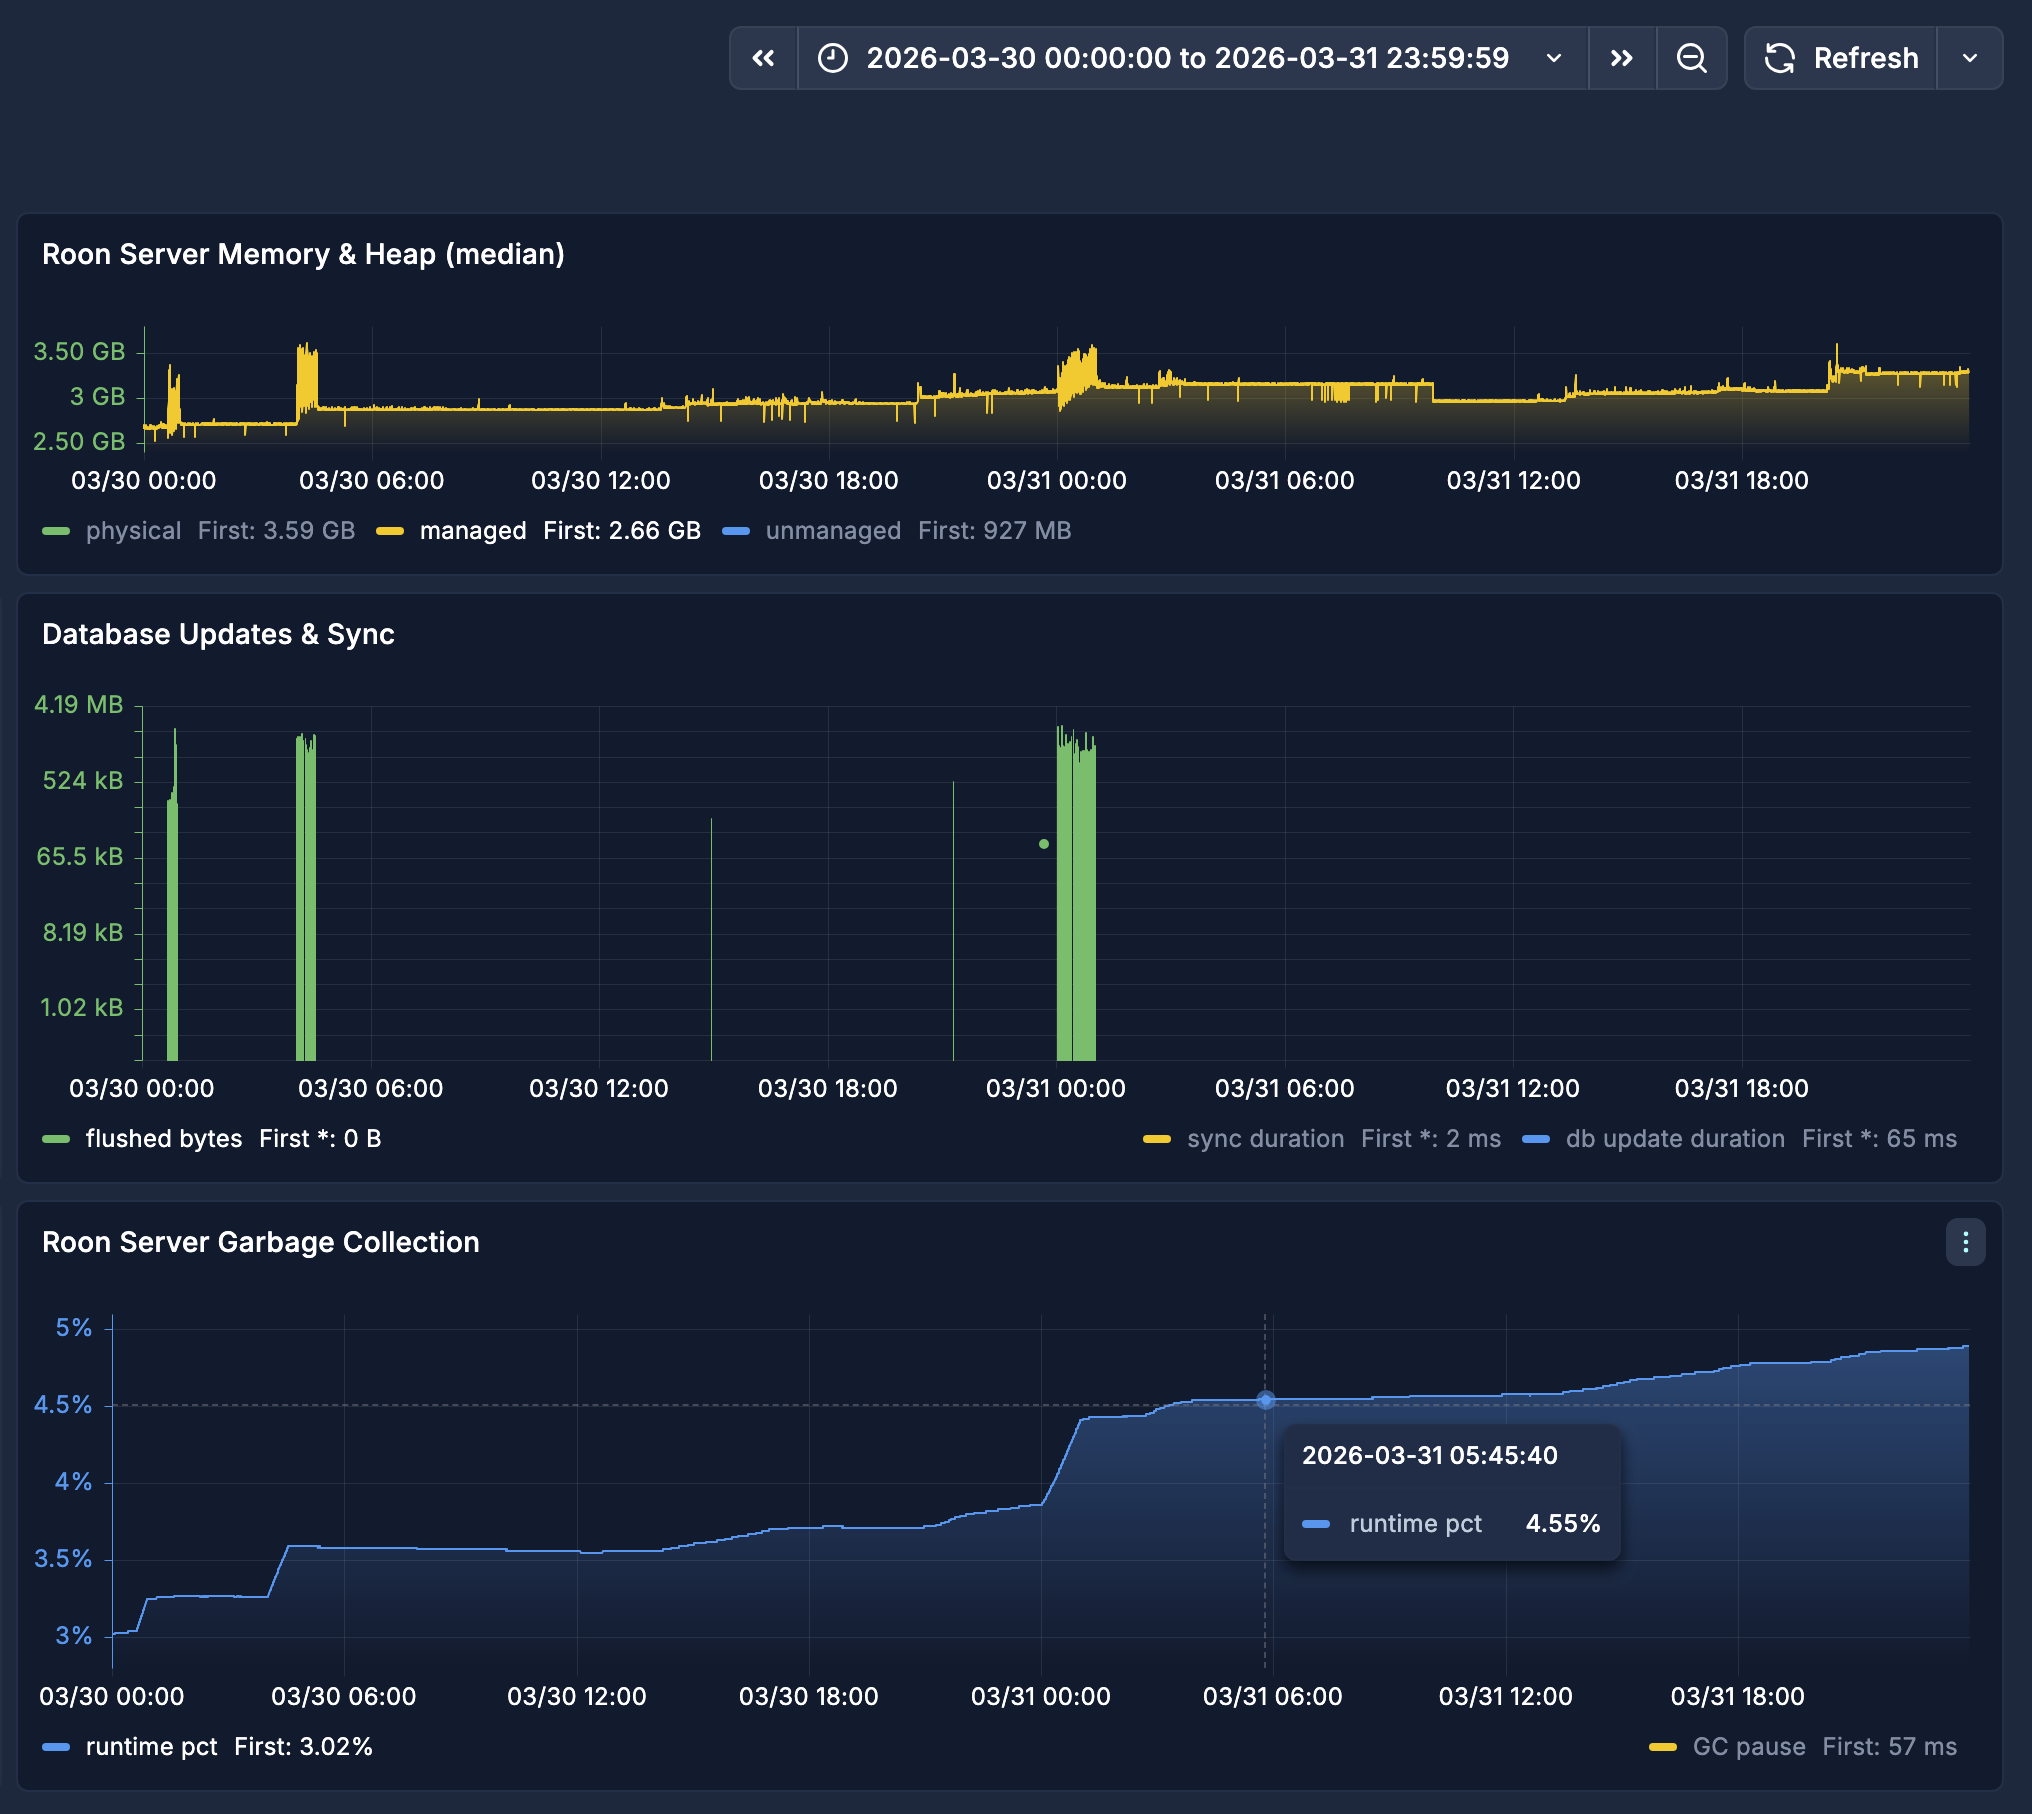
Snapshot of my Roon server memory and heap stats
Top panel shows normal physical memory in green for 24 hour period
Top panel shows normal unmanaged space in blue for 24 hour period
-
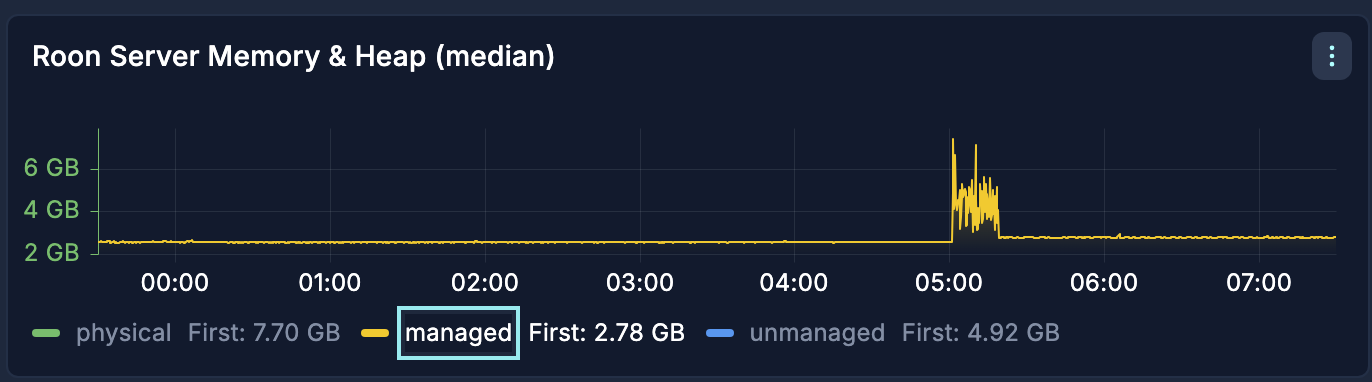
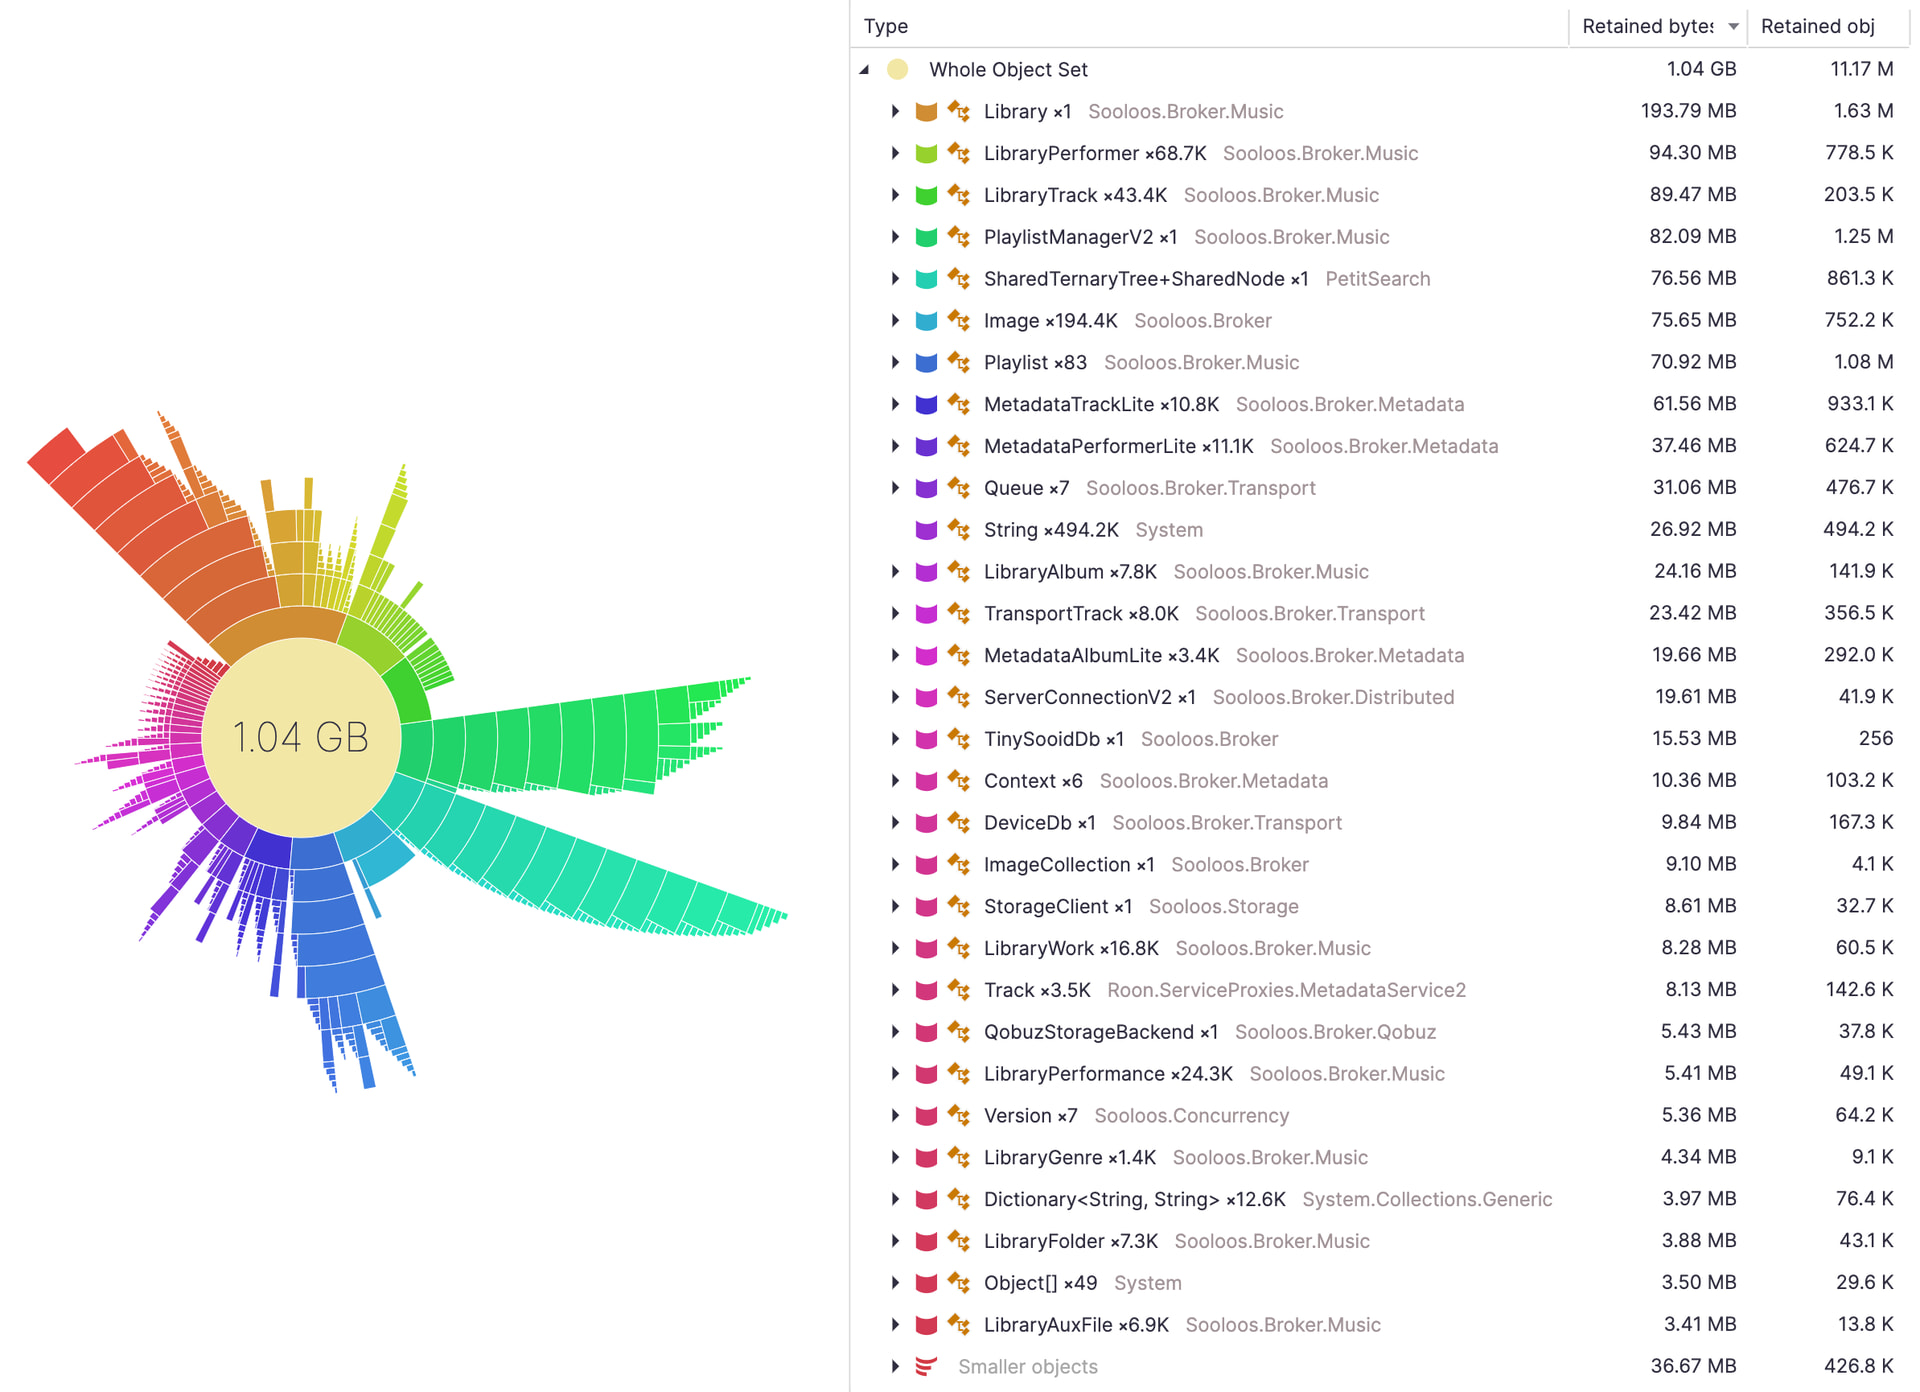
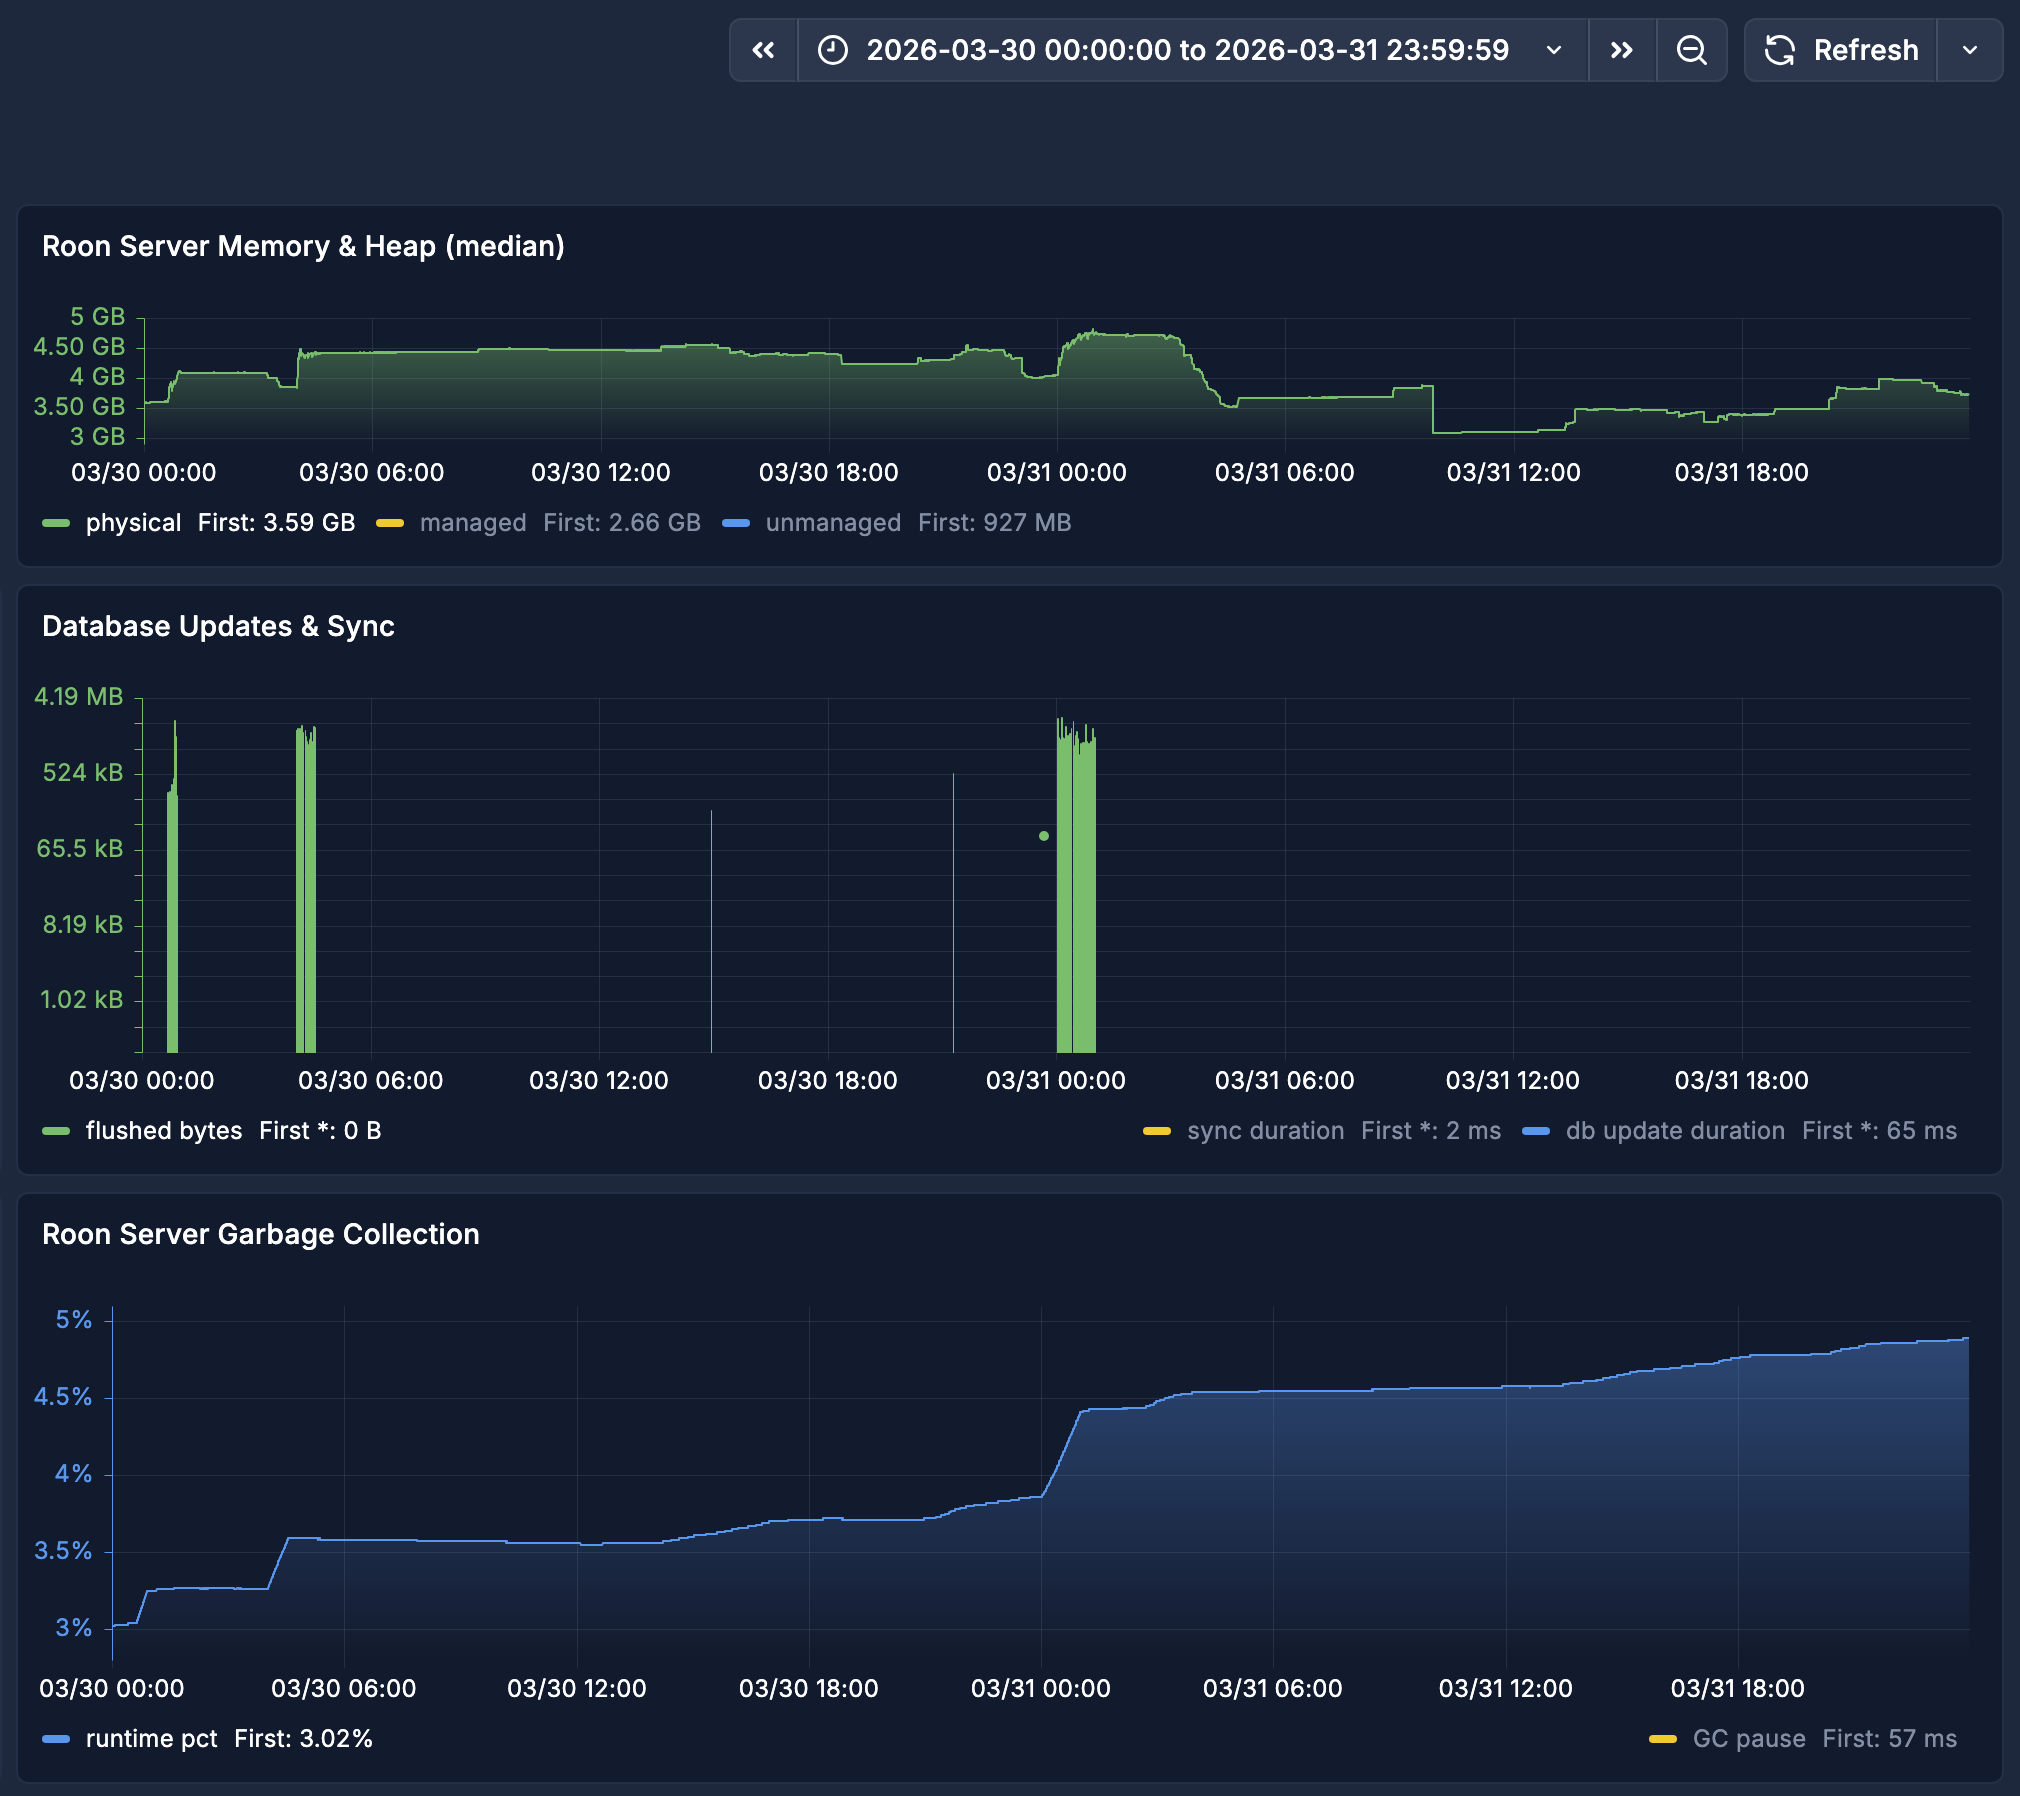
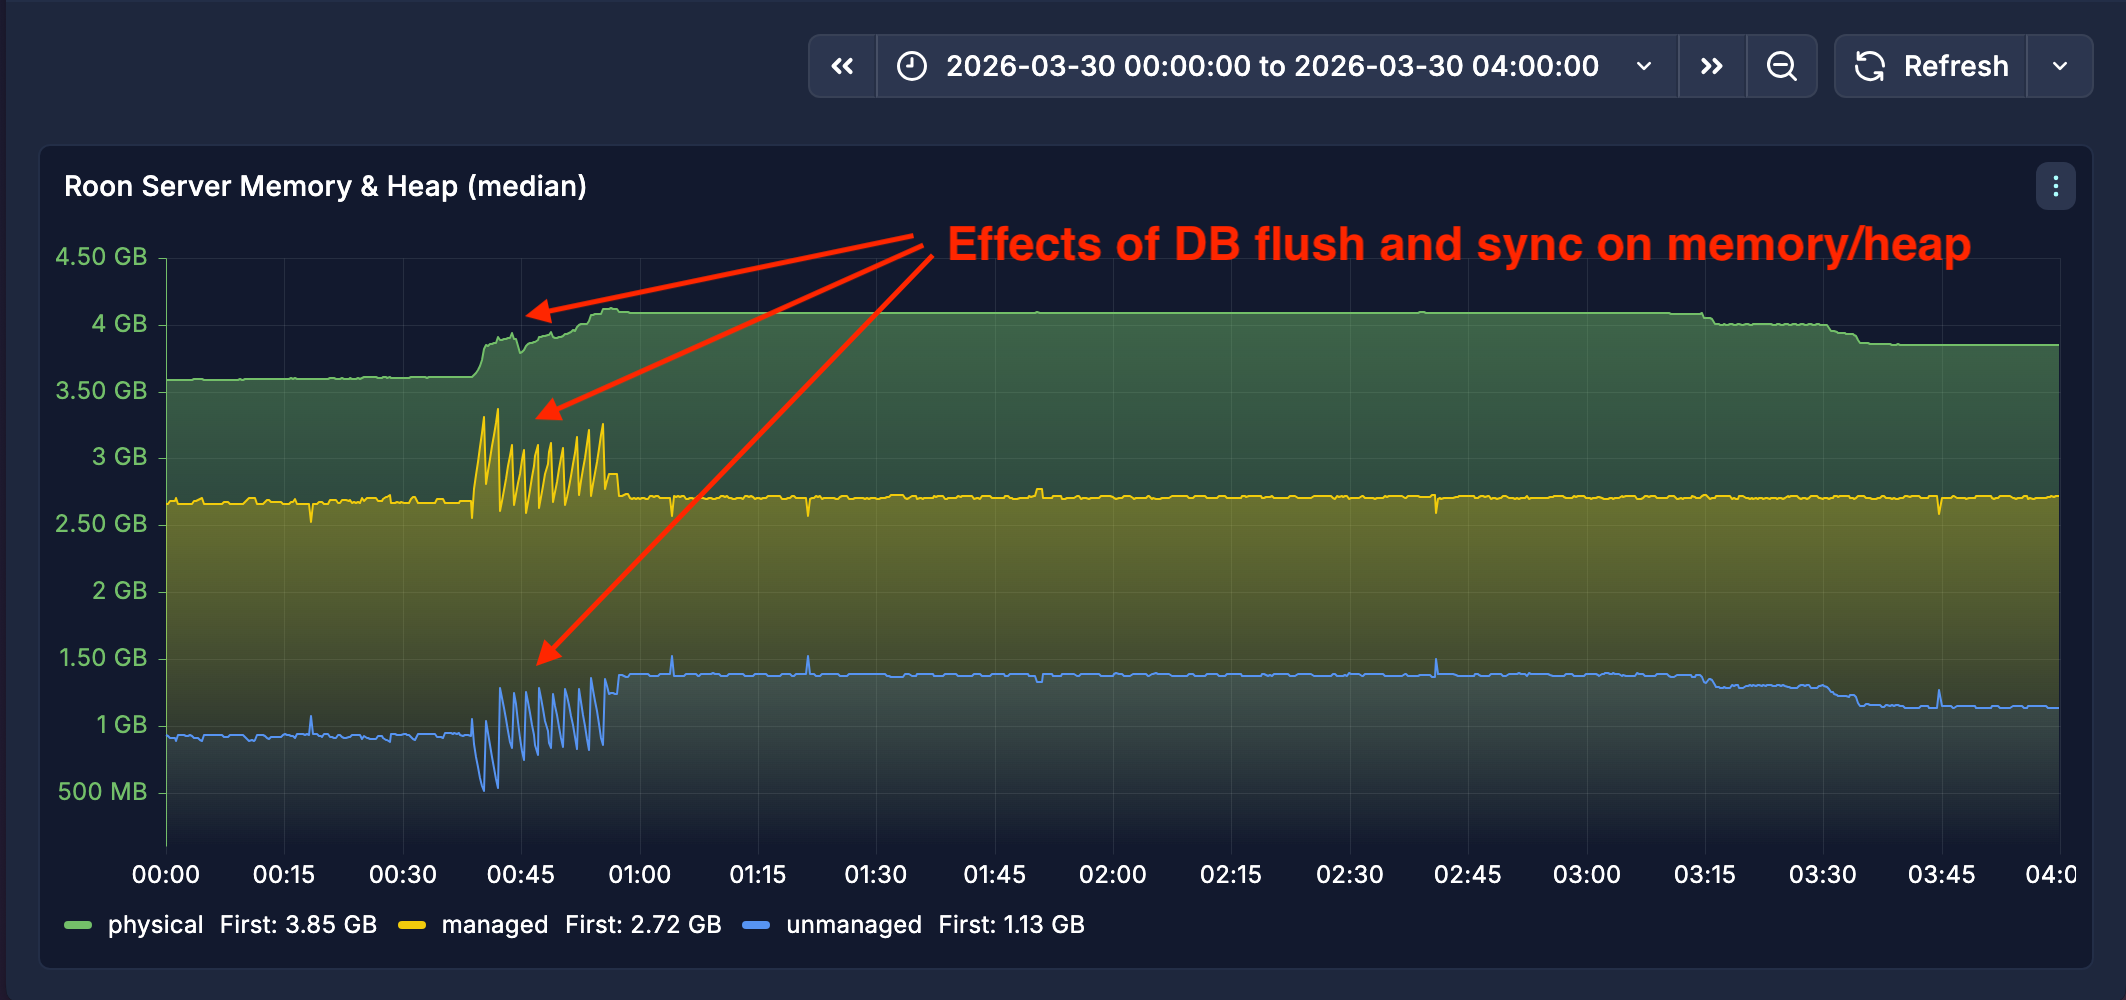
Specific Roon objects move between managed and unmanaged memory in mirror-like fashion. For example, database flushes result in growing the heap by hundreds of kilobytes to megabytes while the unmanaged space shrinks by a similar amount.
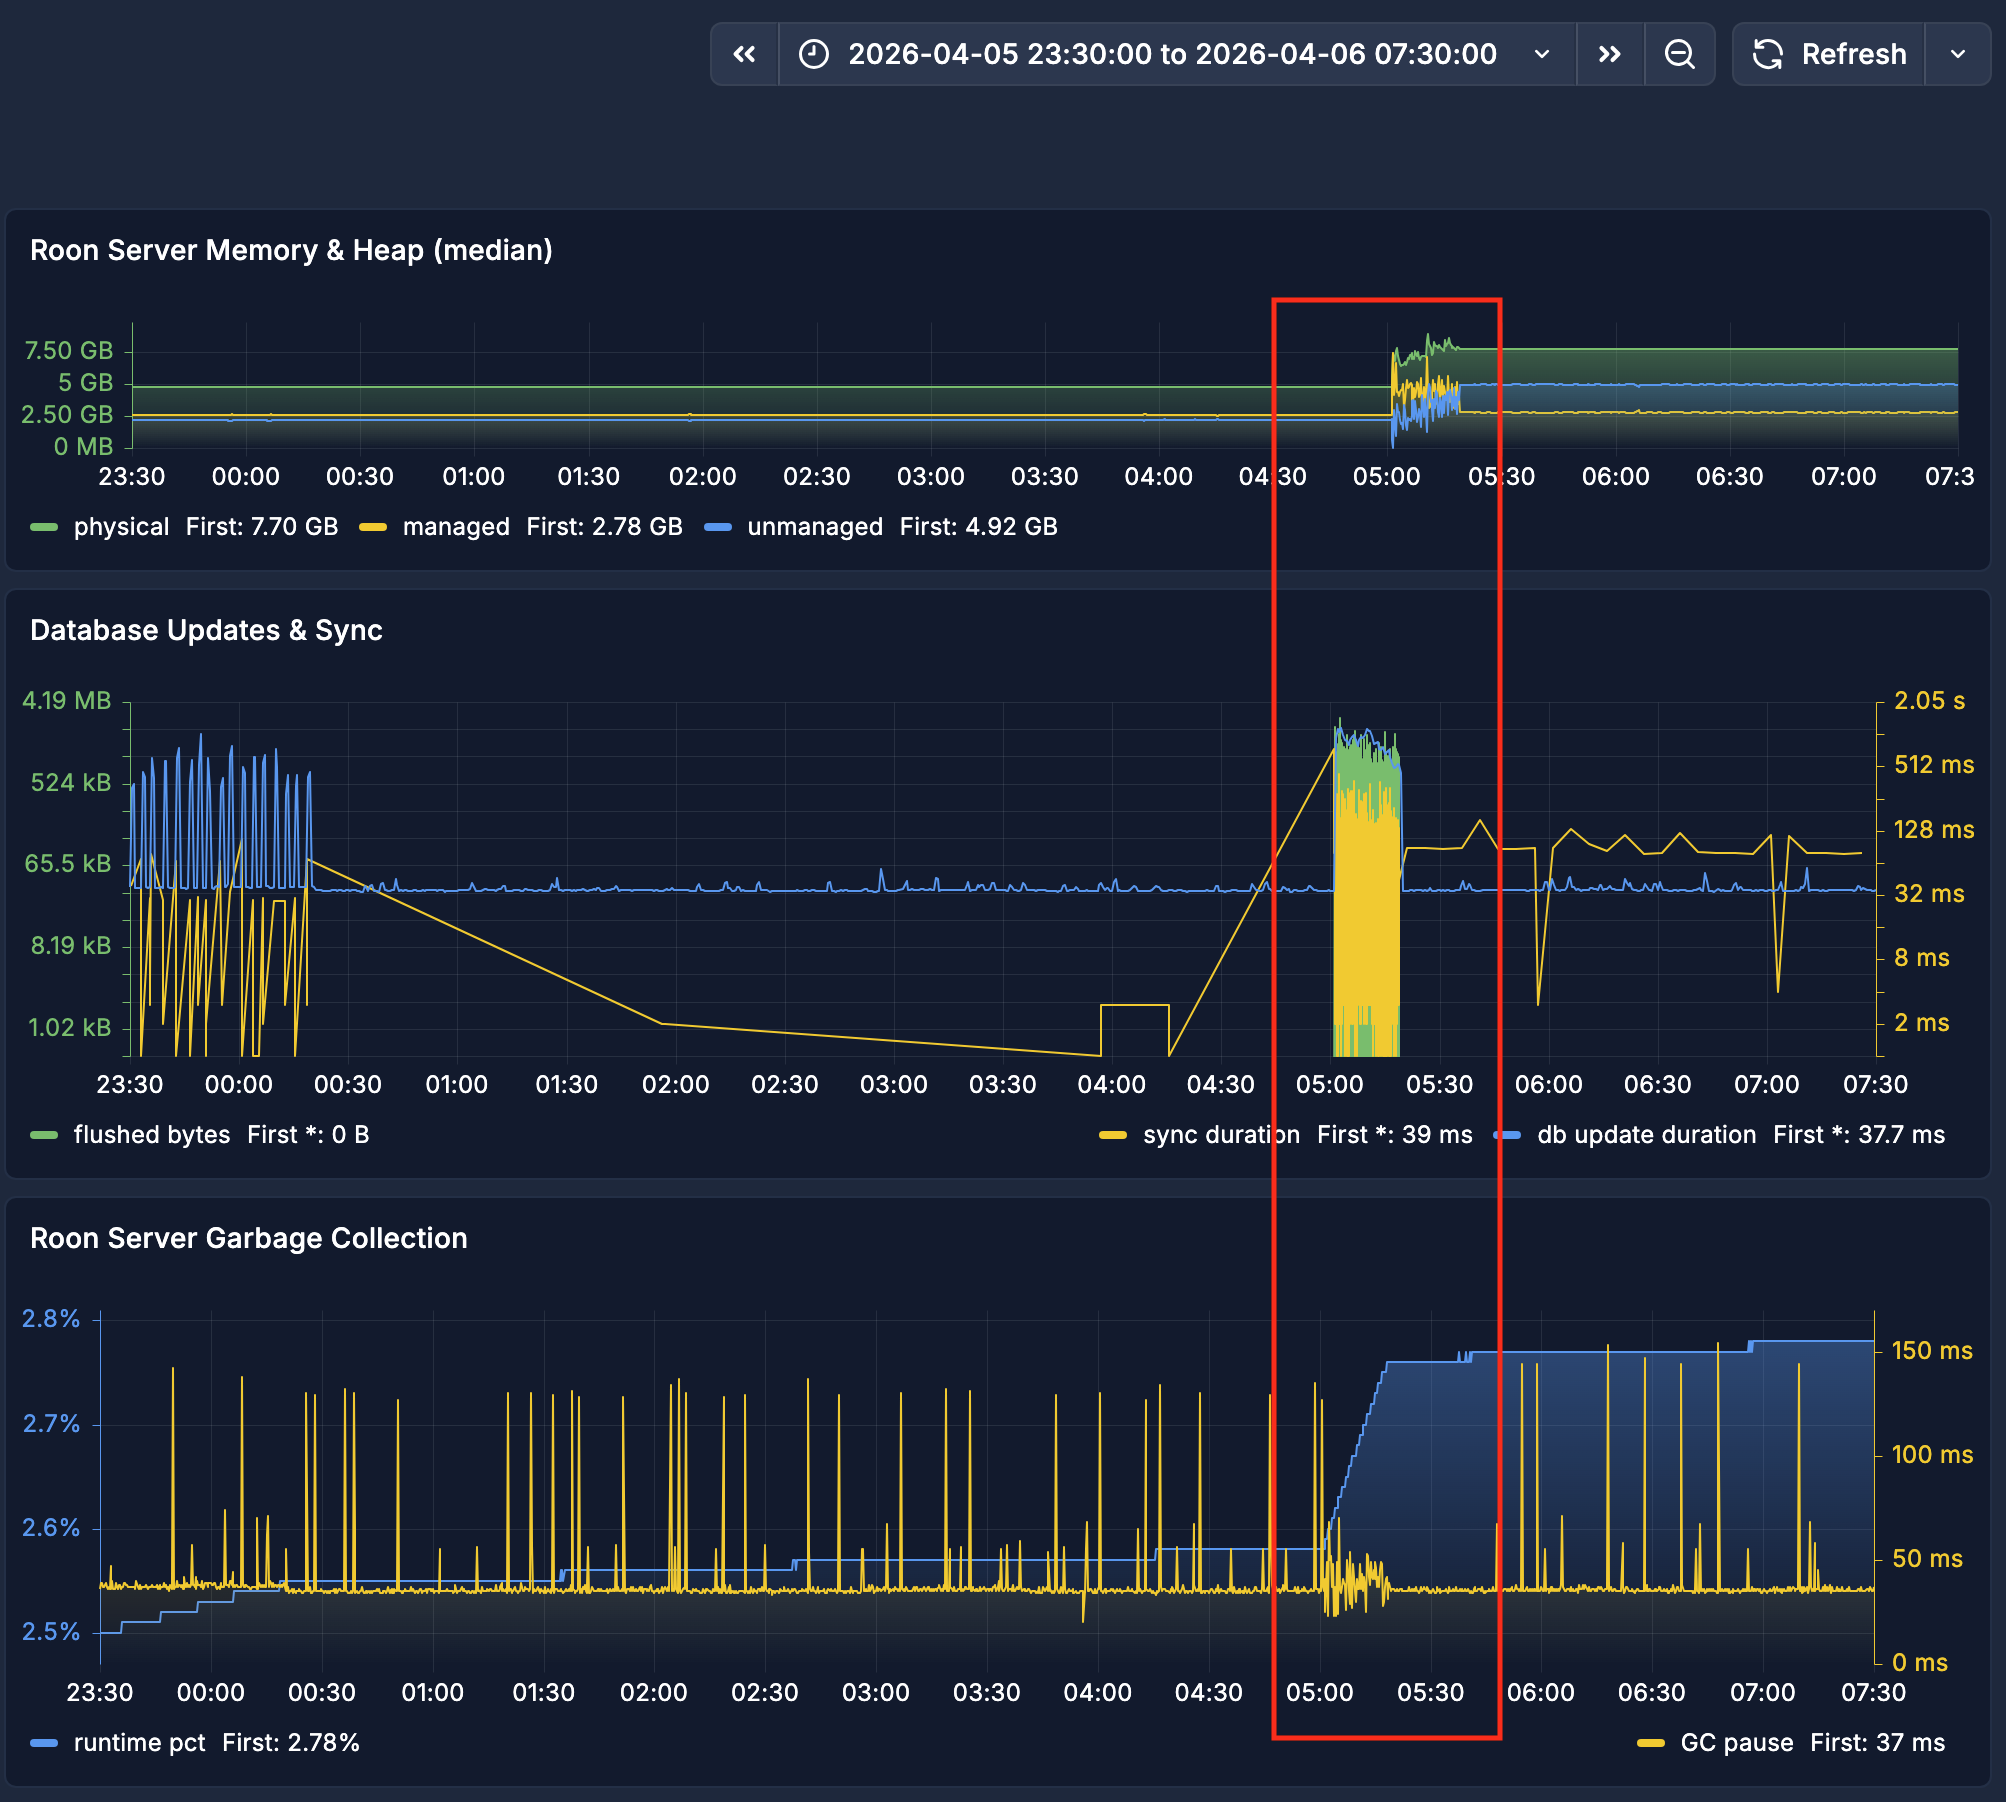
Effects of Leveldb flush on memory and GC in 4 hour period
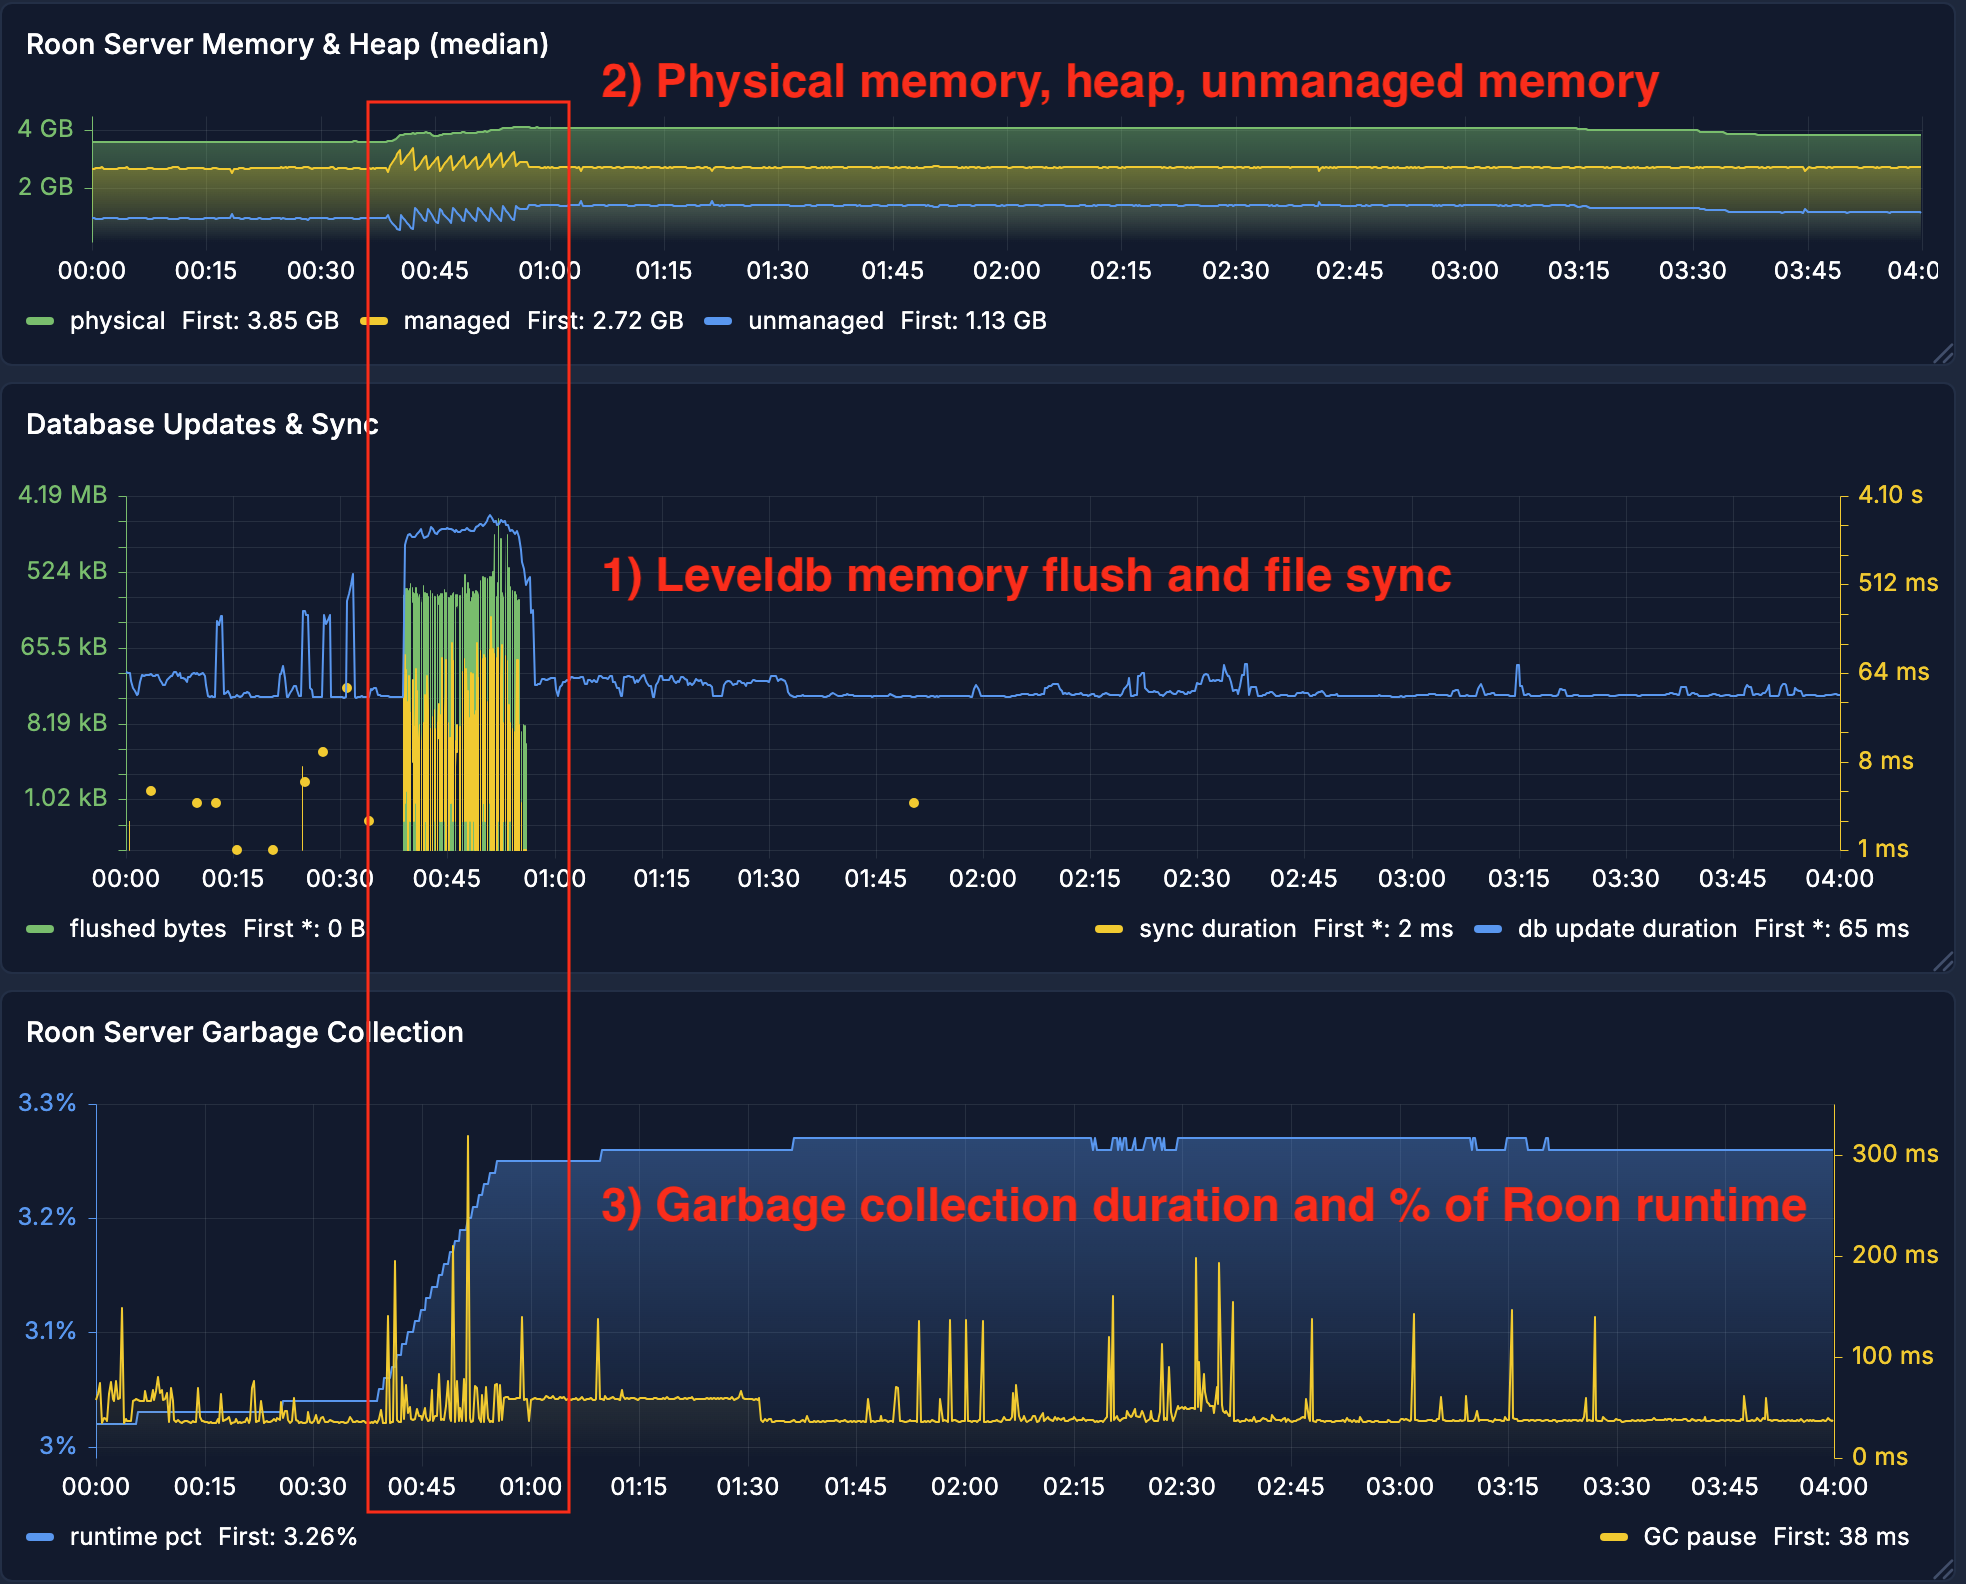
Correlated effects of Leveldb flush on memory and GC in 4 hour period
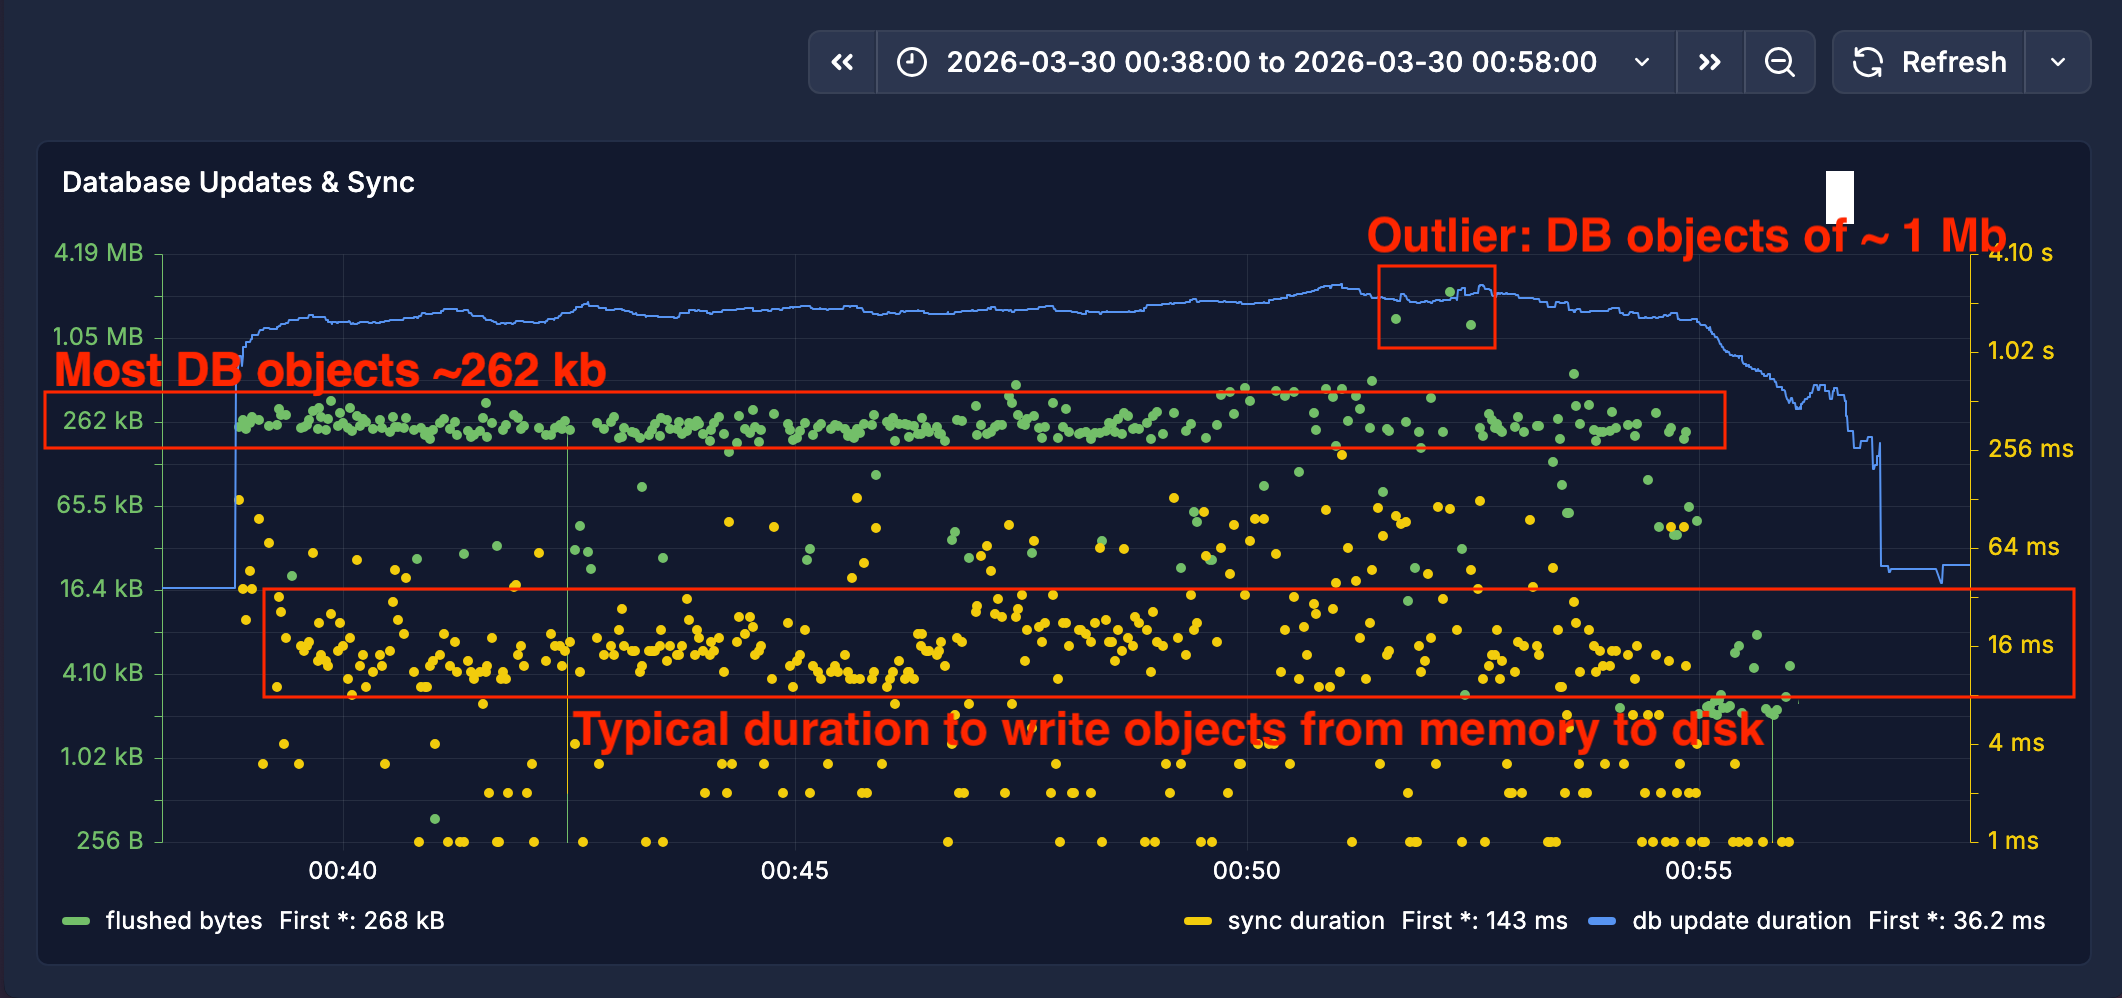
Zoomed in view shows size of flushed db objects in 20 minute period
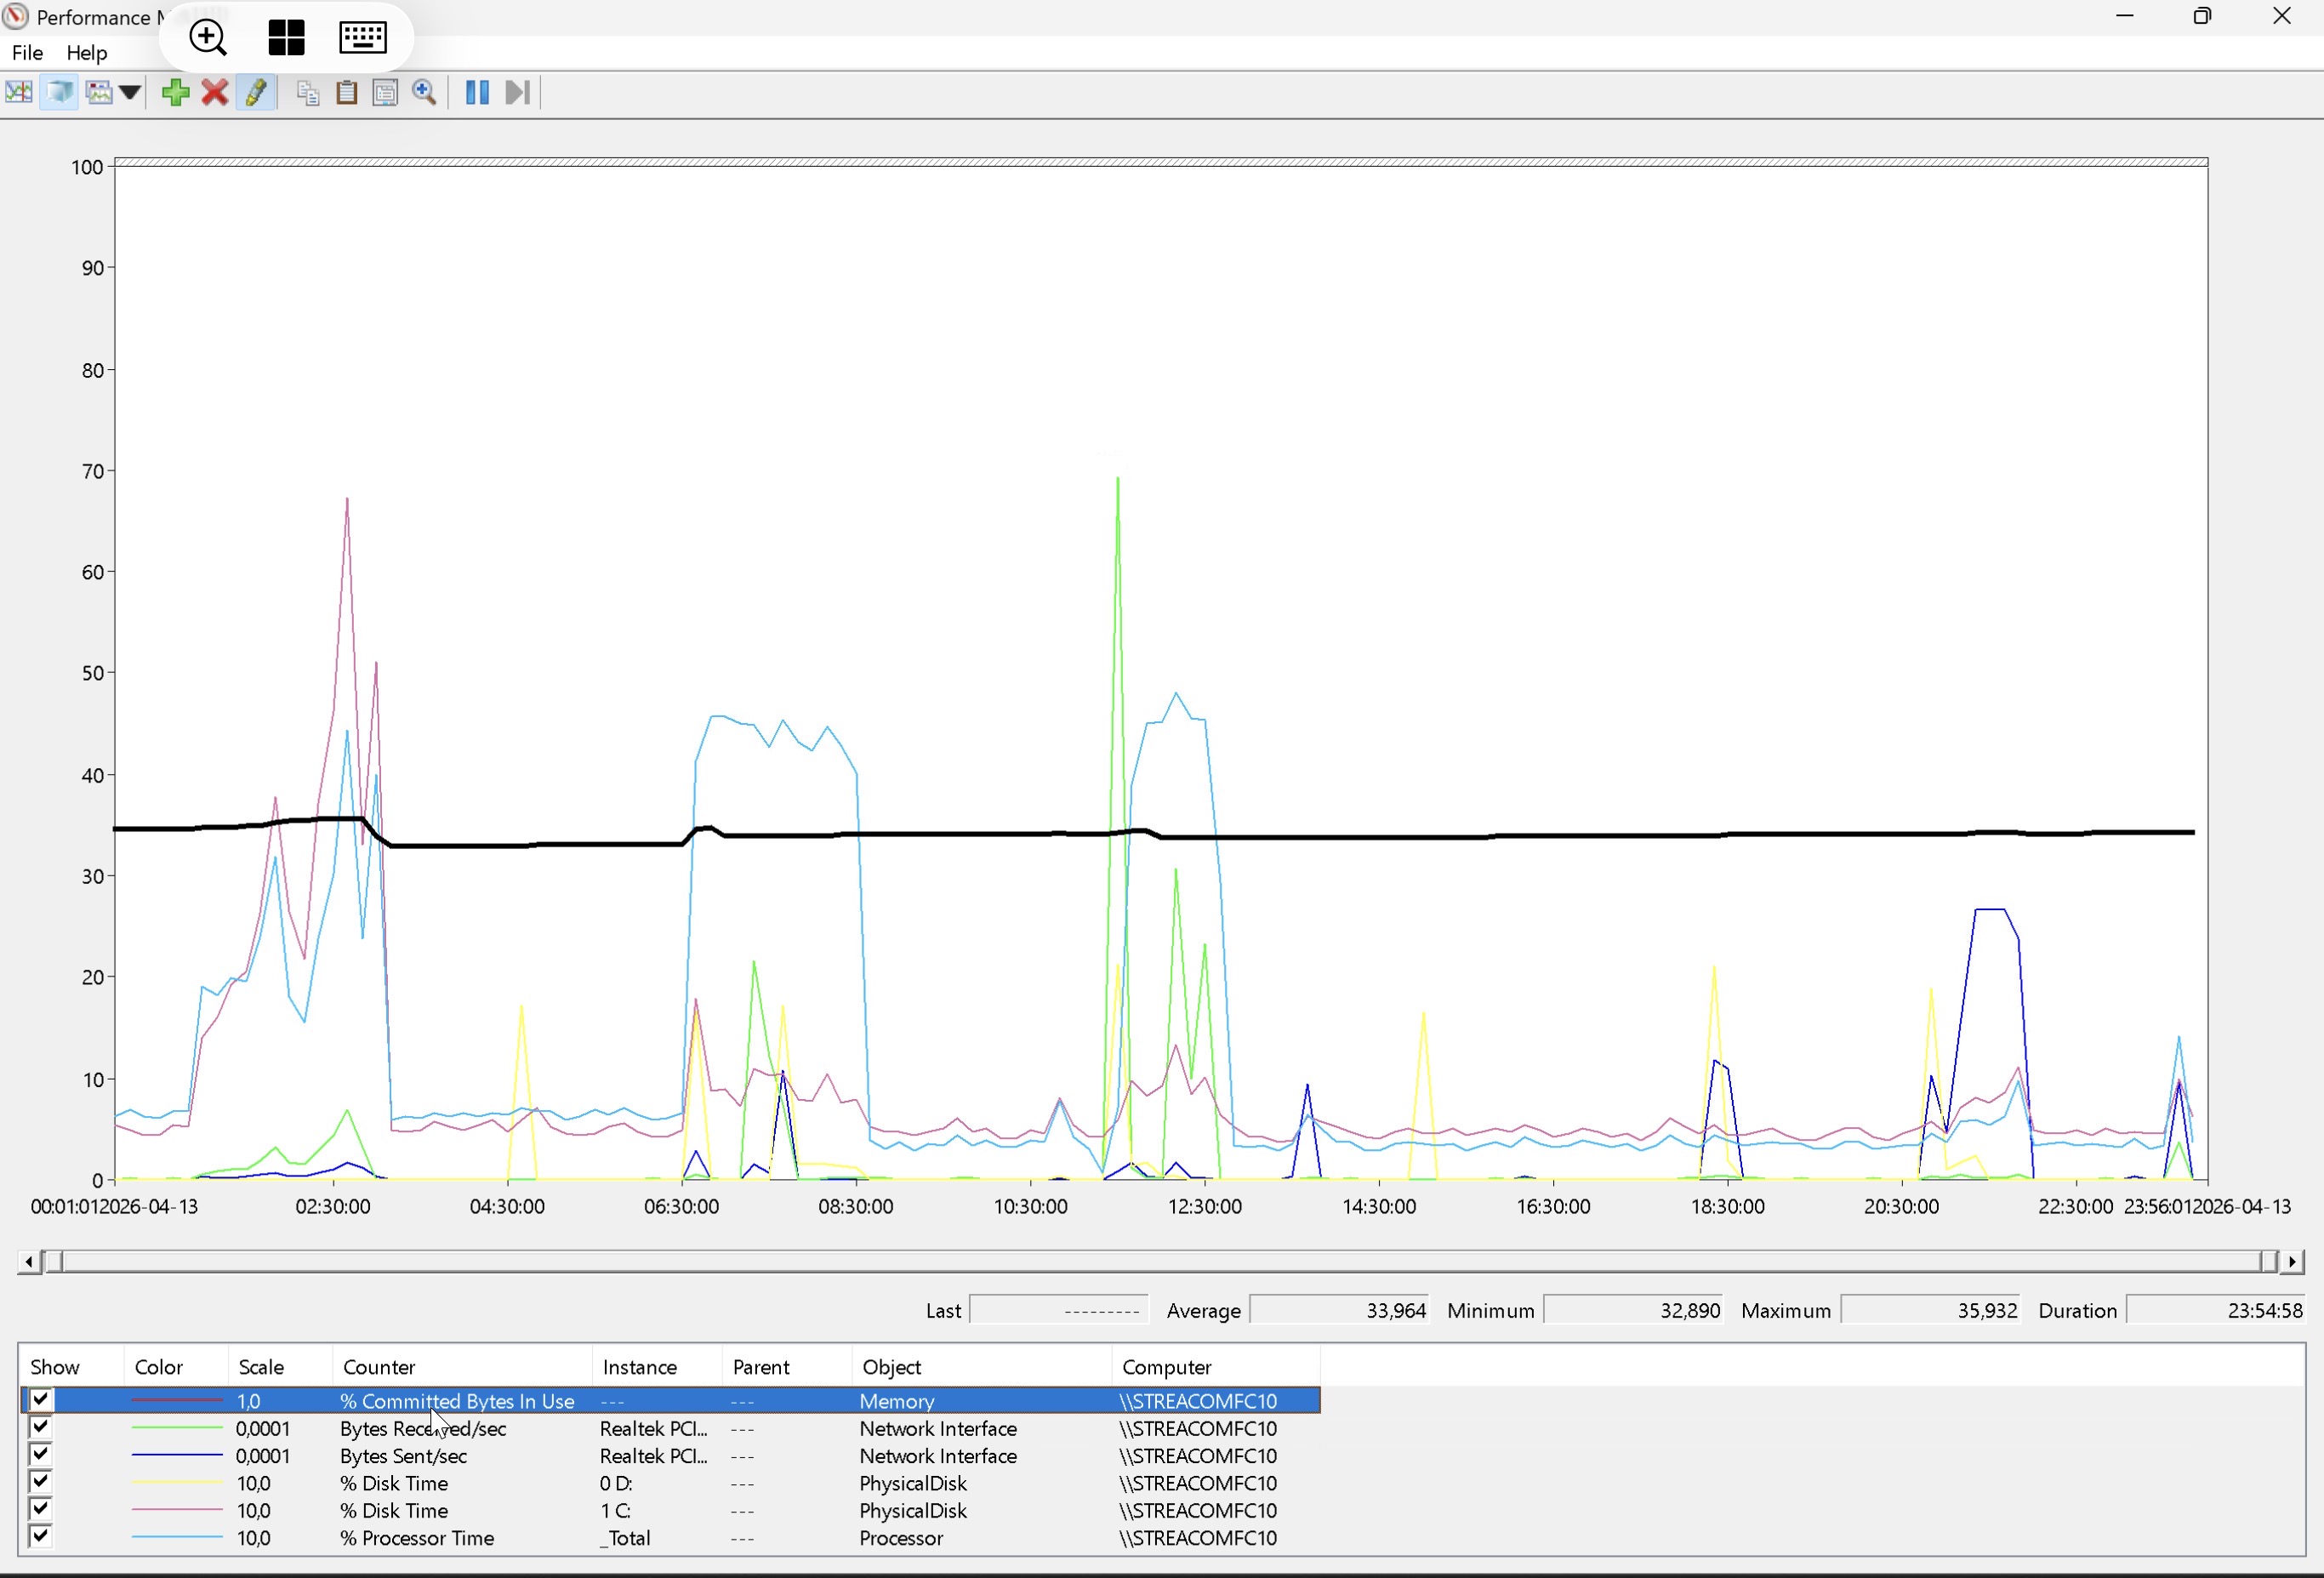
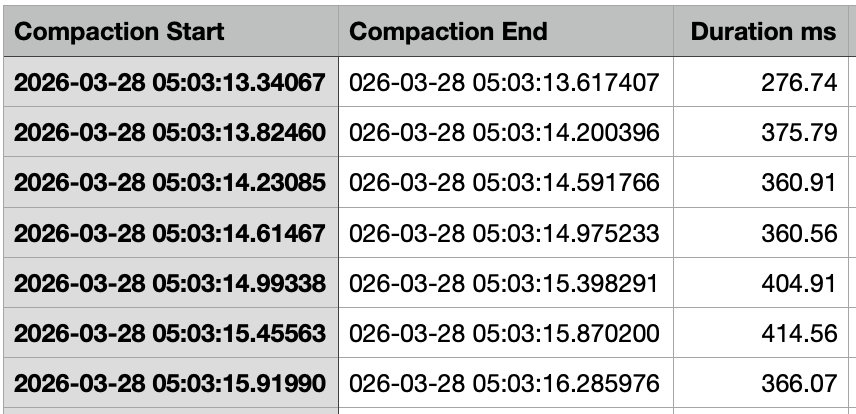
Interesting event (but probably not related to the memory pressure) is Leveldb compaction at the file level that happens throughout the day. These events are CPU intensive as compaction will use all the resources available at the time.
Example of how long compaction can take
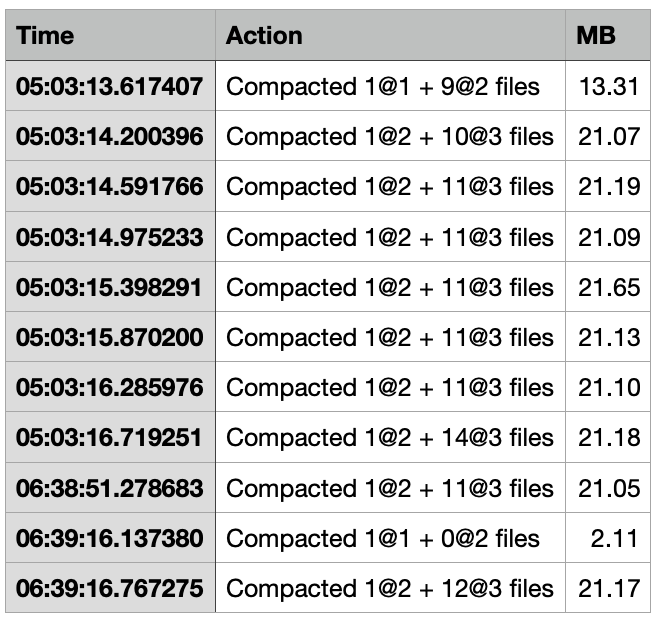
Example of the size of data being created, deleted, organized, and compacted
-
There are 2 periods during the day (one of them is scheduled library maintenance) with long running database flushes. After those events, the heap continues to grow, while unmanaged memory and overall physical memory can shrink.
Top panel shows heap in yellow for 24 hour period
-
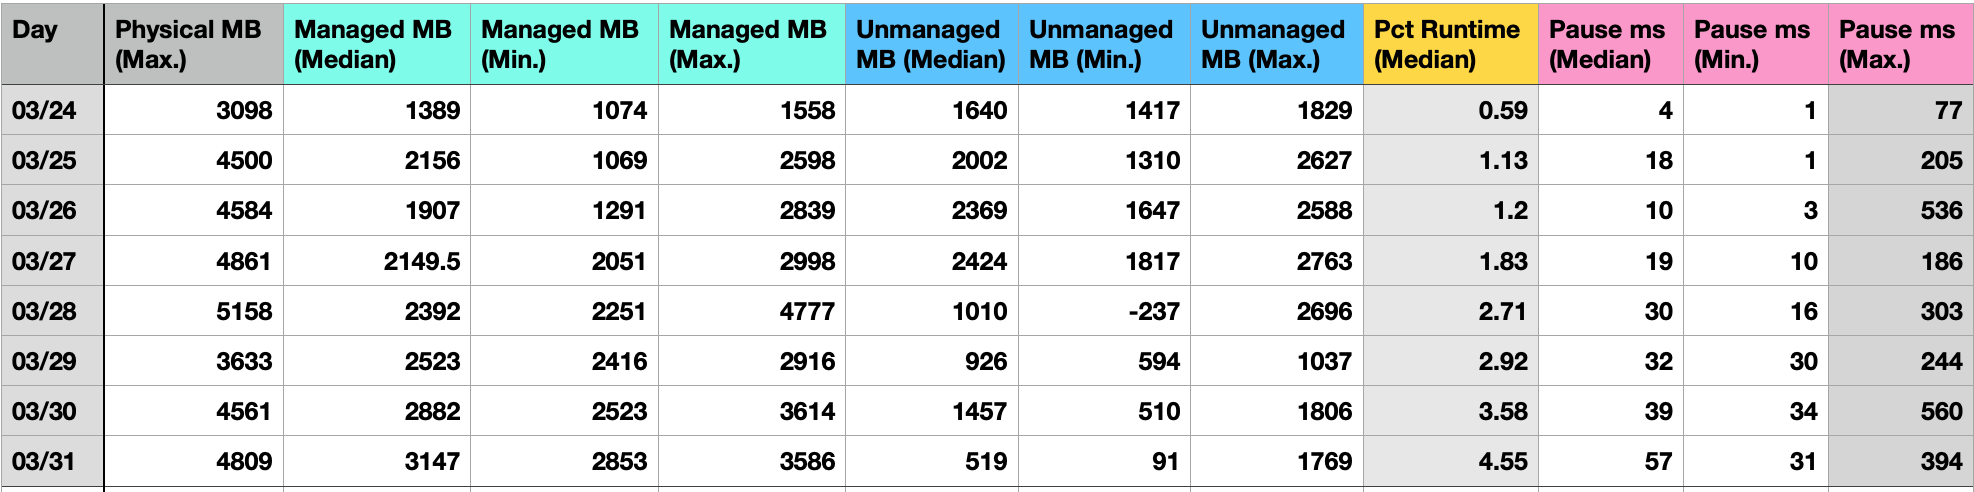
This leads to more frequent garbage collection and GC pauses take longer.
Log summary grouped by day shows increasing GC pauses for 8 day period - note the max pause duration
- Roon restarted on Mar 24
- Roon remote will “lag” if it interacts with the server during a half second GC pause
-
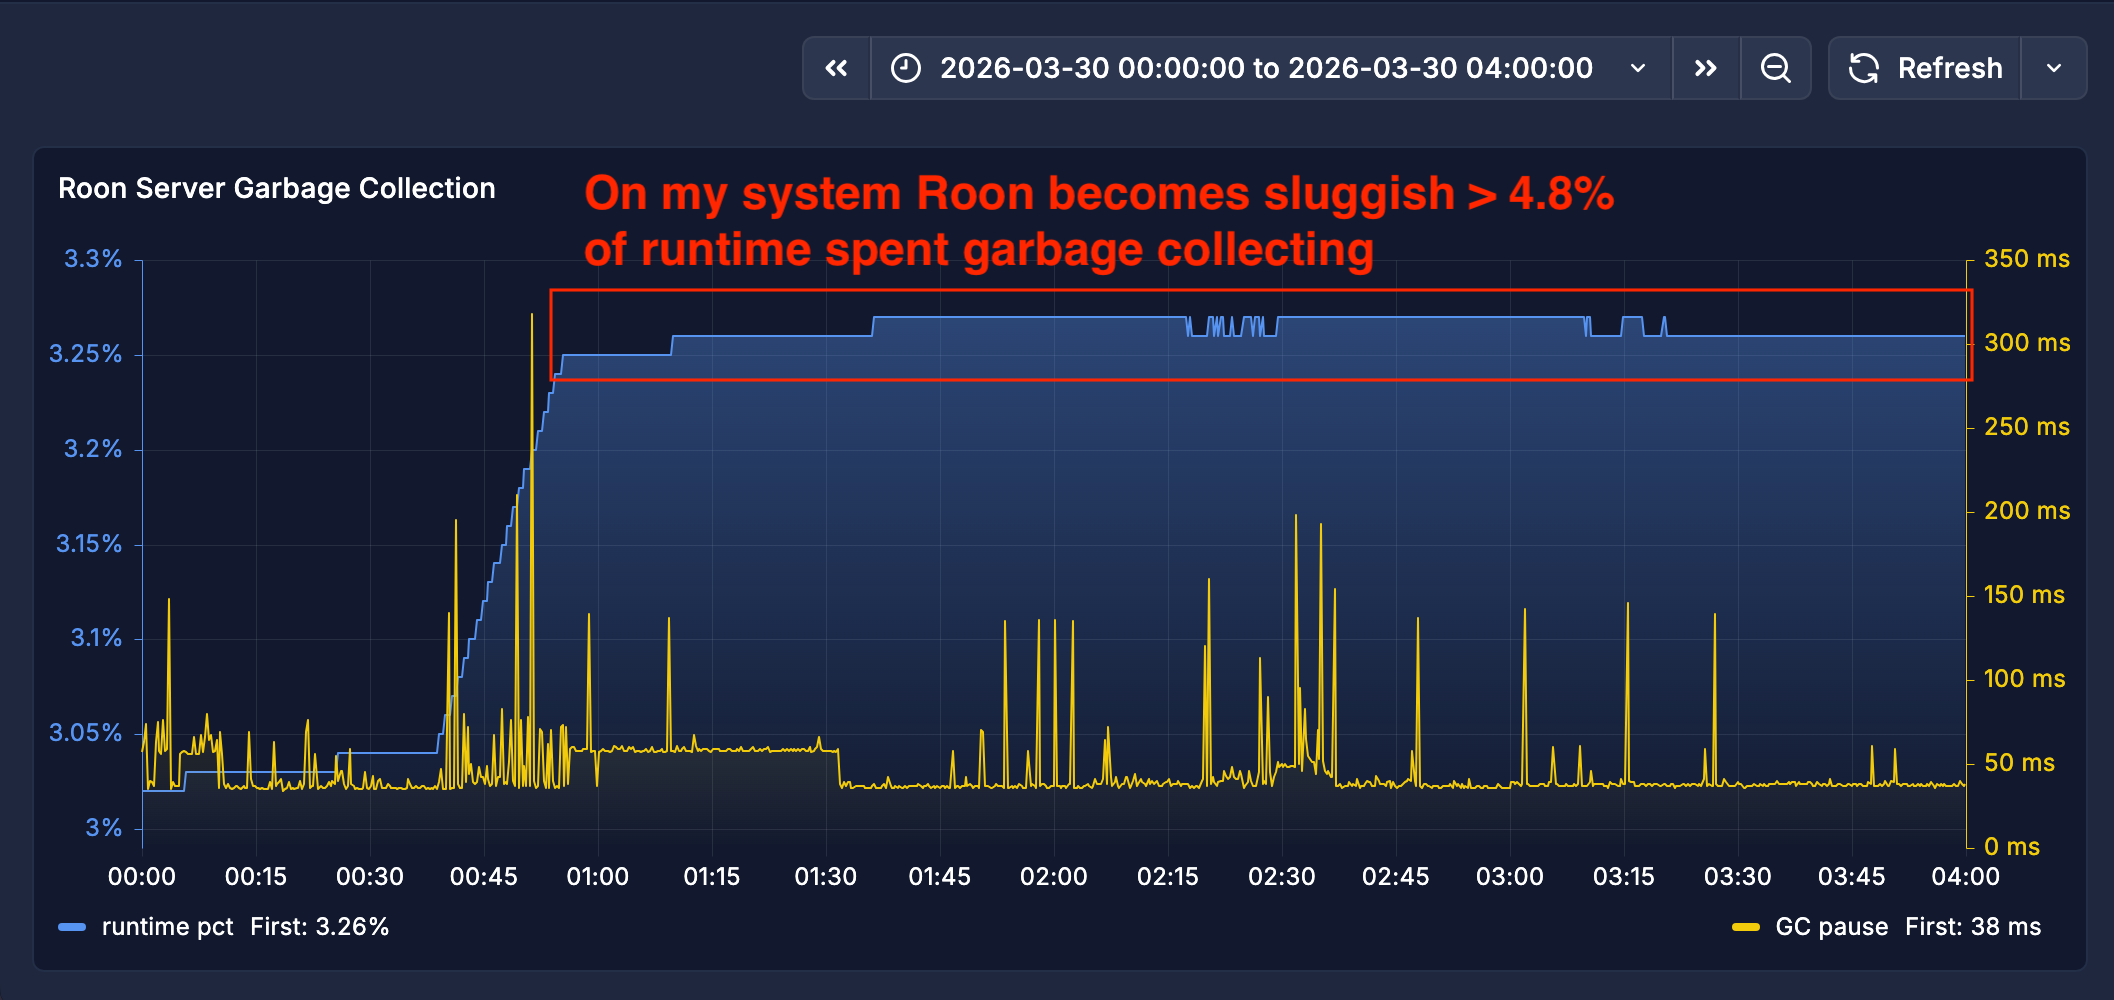
The percentage of time spent garbage collecting becomes noticeable when it approaches 5% for my setup.
% of Roon’s runtime spent garbage collecting continues to increase
Processor: 3.3 GHz Quad-Core Intel Core i5
Memory: 32 GB 1600 MHz DDR3
Disk: Samsung SSD 860 EVO 2TB
OS: Mac OS Sequoia 15.7.5
Roon: v2.63 (build 1644) early access
Database size: 1.061 GB
Related discussions
Jun 2022
“The RAM usage on Roon OS grows relational to the library size being managed by Roon.”
Jun 2022
“Resolved a possible memory leak appearing during audio analysis. Resolved a possible memory leak in the connection management mechanism”
Mar 2023
"Memory management on modern operating systems is very complex, and the stats about memory consumption at these levels are often misunderstood because they are incomplete and not intuitive.
Feb 2026
“Based on your library size the amount of physical RAM being used appears correct with no suggestion of a memory leak”
Mar 2026
“I generally keep a close eye on memory stats in the server logs to try and see where and when the nonsense starts (zones disappear, app hangs etc).“
Apr 2026
”The app takes a long time to respond to commands… Yes, rebooting helps, but the issue returns after some time.”
- I’m linking the post from @Tom_Harskamp because he describes Roon slowness that disappears after reboots.
- However, he also includes possibly unrelated issues that are discussed elsewhere as known issues, or issues that are specific to a person and their hardware/software.
- “It take a long time to go to Tidal end load the home page of it.”
- “When pick a play list hit play it can take on to 1 minute that the play list or album starts to play.”