After 5 days of not using Roon, sitting idle Apr 6 - Apr 10, garbage collection pauses are still greater than 100 ms ![]()
Memory Summary April 4 - April 14
-
Virtual: 47 - 49 GB
-
Physical: 3.3 - 5.5 GB
-
Managed: 1.99 - 2.4 GB
-
Unmanaged: decreased from 3.1 GB to 1.3 GB
Garbage Collection Analysis
GC pause percentage grew, but physical memory usage decreased from 5.5 GB to 3.3 GB over 10 days. The garbage collector is becoming less efficient, but it is working as expected by reclaiming large amounts of memory and preventing a memory leak.
-
Frequency: Roon logs [stats] every 15 seconds, so at least one garbage collection about every 15 seconds.
-
Pause duration: the last GC pause duration ranges from 15 ms to 72 ms.
- Relatively short duration but they’re consistent.
- Pauses > 100 ms is when people typically notice hiccups with Roon.
-
Percentage of runtime in pauses: ruh roh - percentage grows from 1.44% at the start of the logs to 2.17% by the end.
Cumulative overhead of garbage collection
| Date | Min (%) | Max (%) | Average (%) | Median (%) | Std Dev (%) |
|---|---|---|---|---|---|
| 04/04 | 1.44 | 2.02 | 1.78 | 1.73 | 0.13 |
| 04/05 | 2.02 | 2.53 | 2.25 | 2.22 | 0.10 |
| 04/06 | 2.53 | 2.82 | 2.75 | 2.80 | 0.10 |
| 04/07 | 2.82 | 2.94 | 2.91 | 2.93 | 0.04 |
| 04/08 | 2.93 | 2.99 | 2.97 | 2.98 | 0.03 |
| 04/09 | 2.97 | 3.05 | 3.02 | 3.03 | 0.02 |
| 04/10 | 0.16 | 23.72 | 3.11 | 3.02 | 1.01 |
| 04/11 | 0.88 | 2.62 | 1.84 | 1.87 | 0.27 |
| 04/12 | 2.11 | 2.74 | 2.43 | 2.39 | 0.18 |
| 04/13 | 0.07 | 23.88 | 2.47 | 2.75 | 1.35 |
| 04/14 | 1.66 | 2.17 | 2.01 | 2.03 | 0.08 |
Notes
-
During steady-state operation (e.g., 4/7 to 4/9), the pause percentage increased at a low rate of ~0.1%.
-
On 4/10 and 4/13 the pause percentage jumps to ~23.8% - Roon spent nearly a quarter of its time frozen for memory management.
-
Drops in Min values (0.16% and 0.07%) were due to manual restarts.
Size Matters
In my case…
-
Tracks: 43.8k
-
Albums: 7.84k
-
Artists: 3.95k
-
Works: 17k
-
Performances: 24.6k
Yours is probably larger (see what I did there?).
Large Data Moves across the Heap
Read about Roon’s fascinating search engine technology at Brian Luczkiewicz – Roon Labs
The rising GC pause percentage and high memory usage are due to how Roon bridges LevelDB and SymSpell with the .NET runtime.
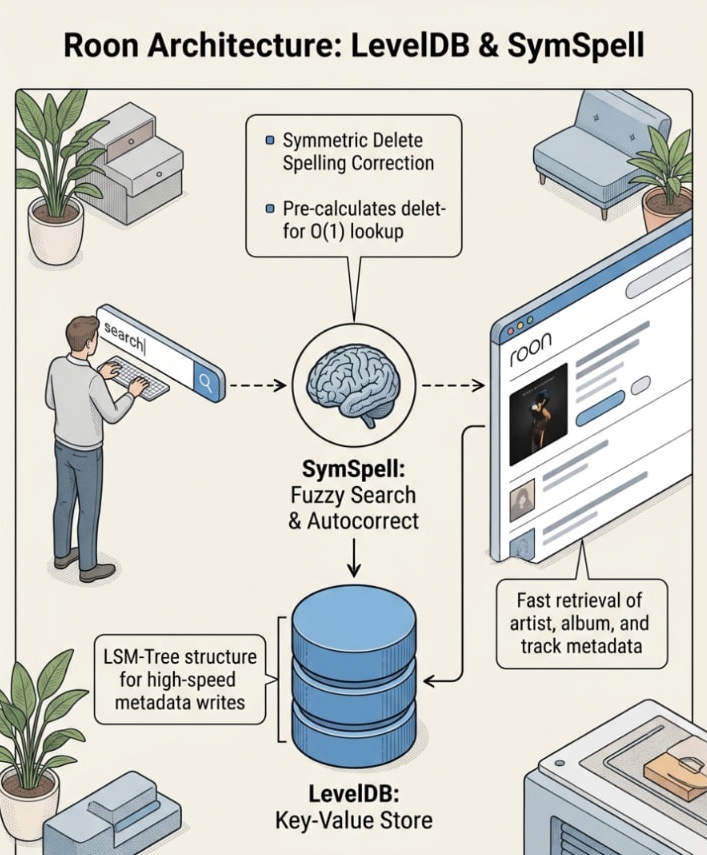
Elephant in Unmanaged Memory
LevelDB is a C++ key-value store and in Roon, it’s the database for our music library.
The memory pressure comes from moving data between unmanaged and managed memory.
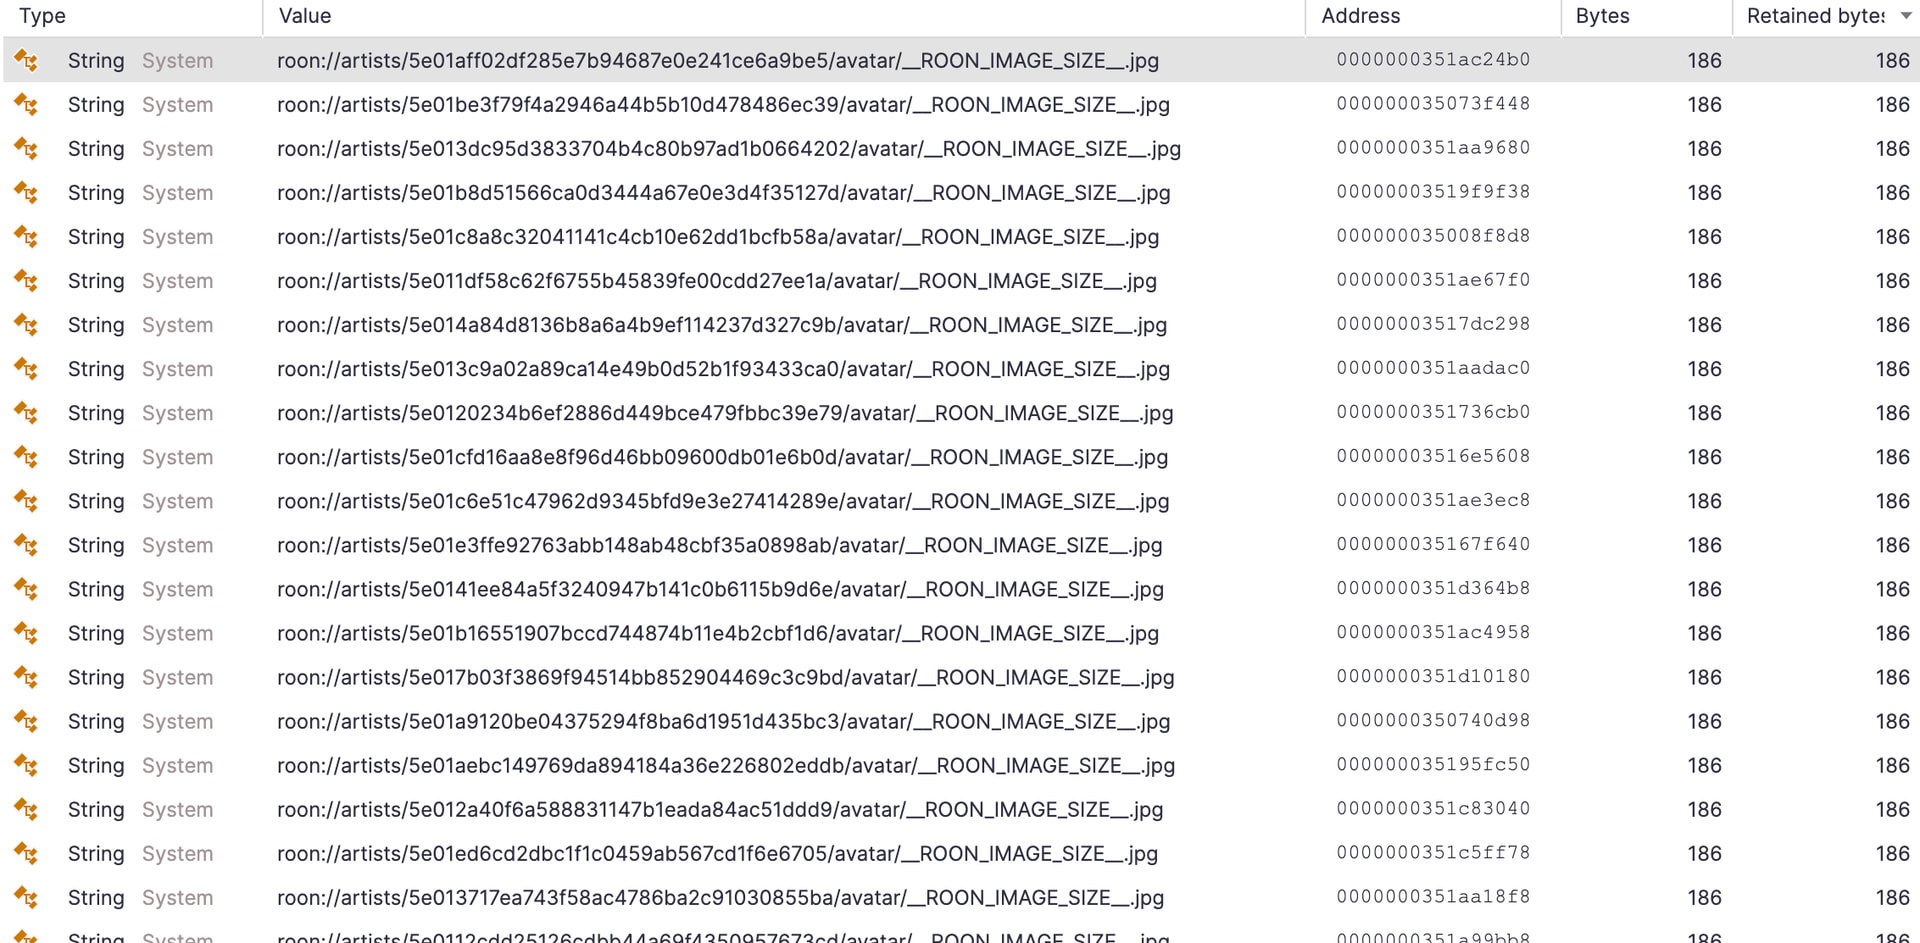
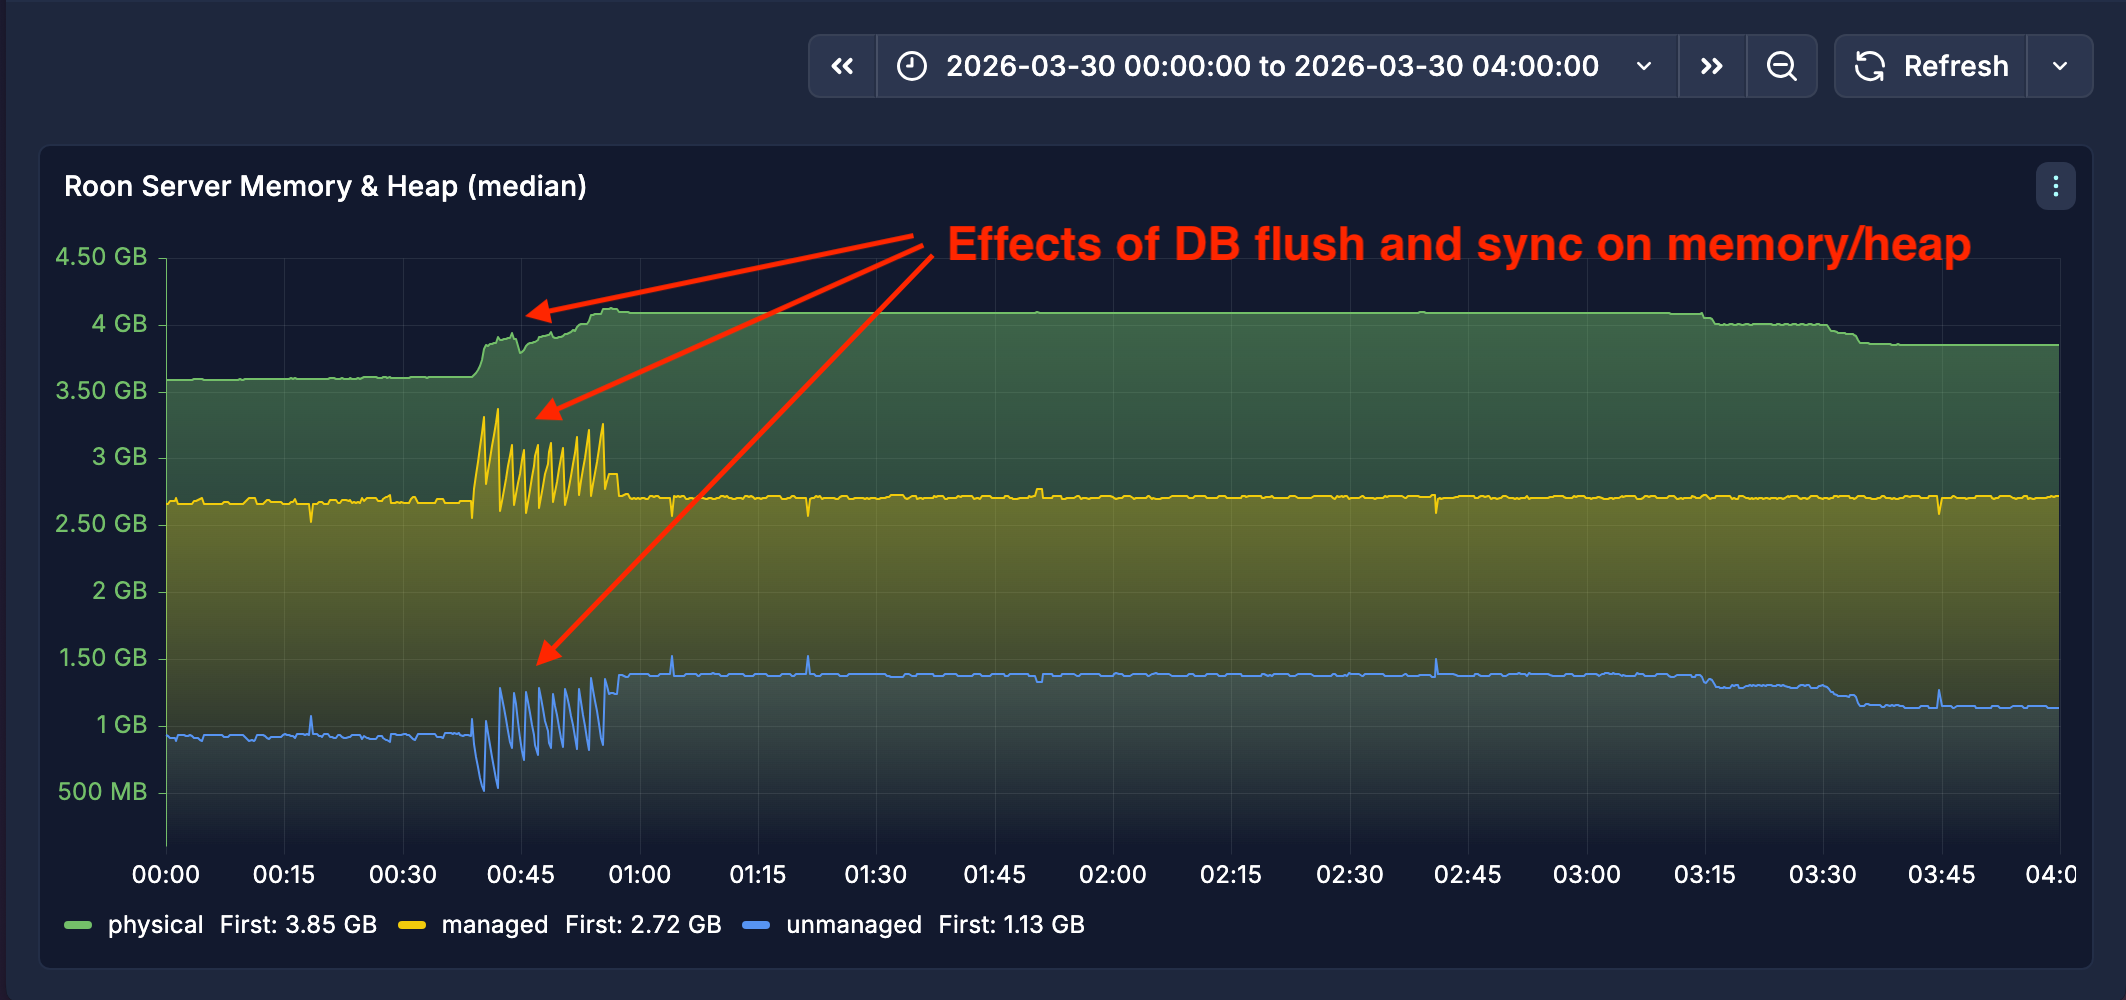
- MemTable flushes: LevelDB stores recent writes in an in-memory MemTable. When this fills up, it flushes the data to disk. During this process, Roon maps these native buffers into the .NET managed heap to process library logic. This creates the mirroring we see in screenshots below: unmanaged memory shrinks as the MemTable clears, but managed memory spikes as .NET objects are created to represent that data.
- Allocation pressure: constant conversion of byte arrays from LevelDB into Track or Album objects in .NET, generates high memory pressure. The Garbage Collector runs frequently to clean up these short-lived bridge objects.
Gorilla in Managed Memory
Roon uses the SymSpell library for very fast type-ahead searching and correcting typos. Unlike LevelDB, SymSpell is entirely in-memory and managed by .NET.
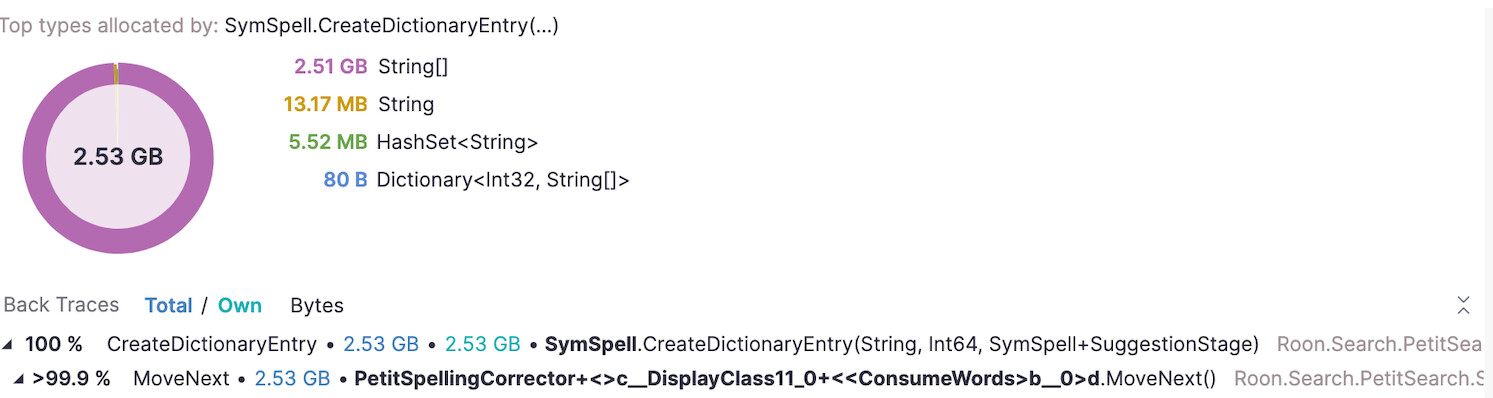
SymSpell pre-calculates every possible delete variation of a word. For a decent size music library, this dictionary becomes a huge graph of millions of small Strings, Lists, and hash table entries in the managed heap.
-
Mark-and-Sweep GC bottleneck: during a garbage collection, the Mark phase walks the entire tree of live objects to see what can be deleted. Because SymSpell keeps a huge, permanent dictionary of strings in memory, the GC has to examine millions of objects every time it runs. This is why the GC pause duration stays high even when Roon isn’t doing much – it must walk the entire graph to see what’s still in use.
-
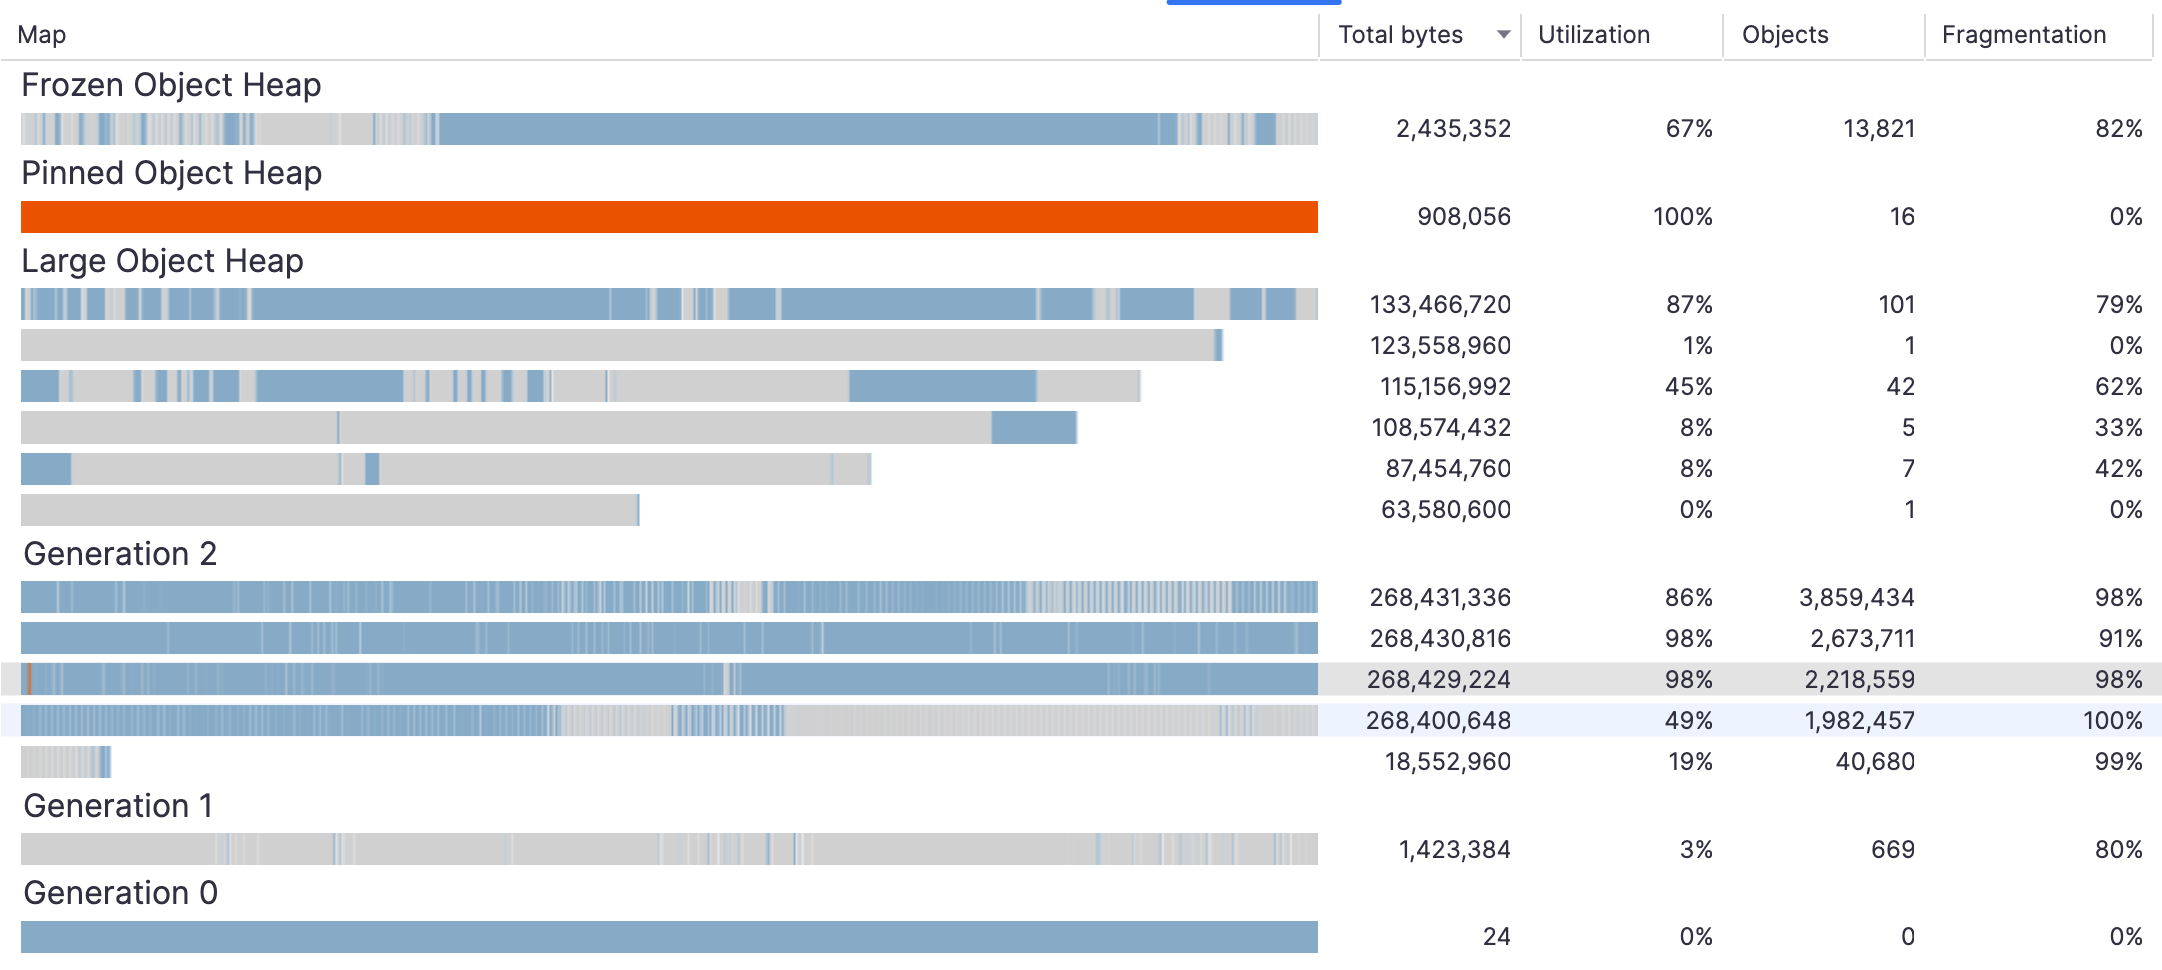
Heap fragmentation: large search dictionaries and database buffers land in the Large Object Heap create gaps in the small object heap. Over time, this fragmentation makes the GC work harder to find contiguous space, which is why % of runtime in GC pauses increases over several days.
AI for Validation?
I’ve spent a couple weeks now learning what Roon’s doing with memory and I’ve shared my ignorance and questions here ![]()
A lot of what I’ve written has been hypothesis driven and assumptions made from reading Roon logs and memory profiling, but I’m still uncertain of what I’m seeing without knowing Roon’s internals.
So I fed some screenshots and CSV files to AI to see what it “thinks”. Take the following with a pinch of salt - I kinda hate its smug assuredness.
[Edit: 2026-04-17] I removed the AI generated content after reading about the Roon community’s stance on AI in the forums ( FAQ - Roon Labs Community ).
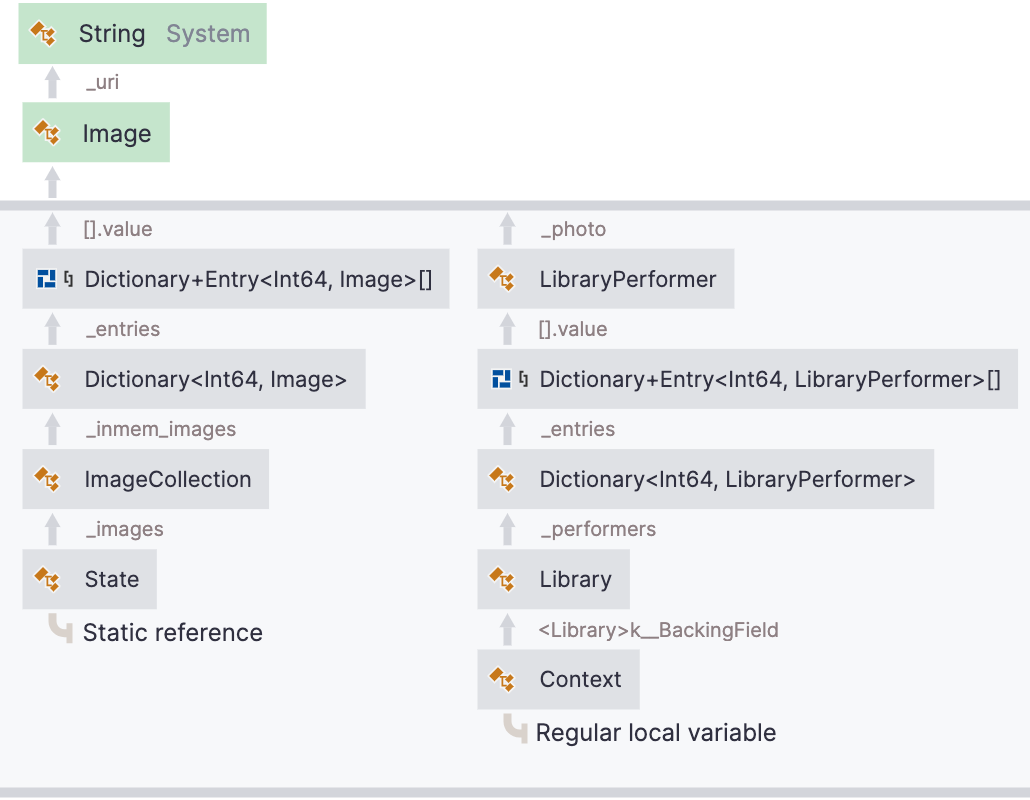
Timeline Analysis of creeping managed heap

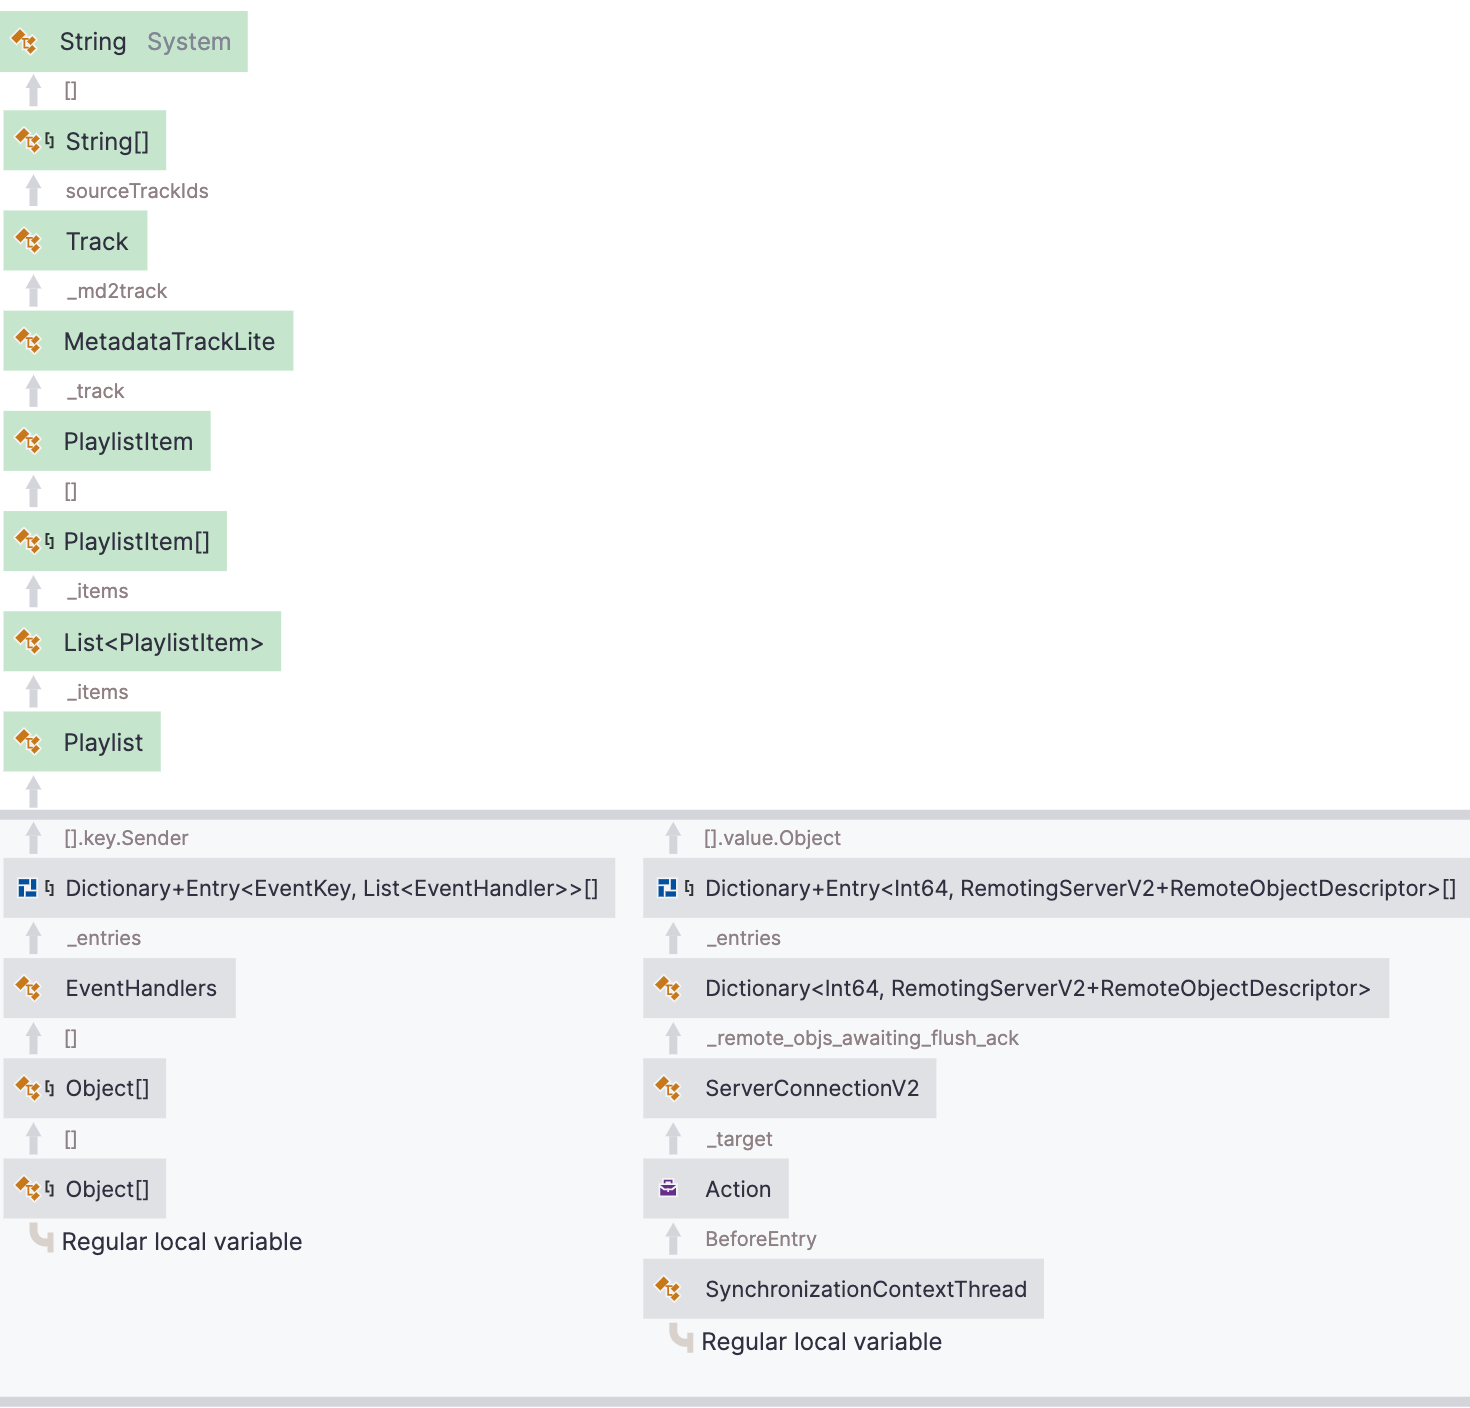
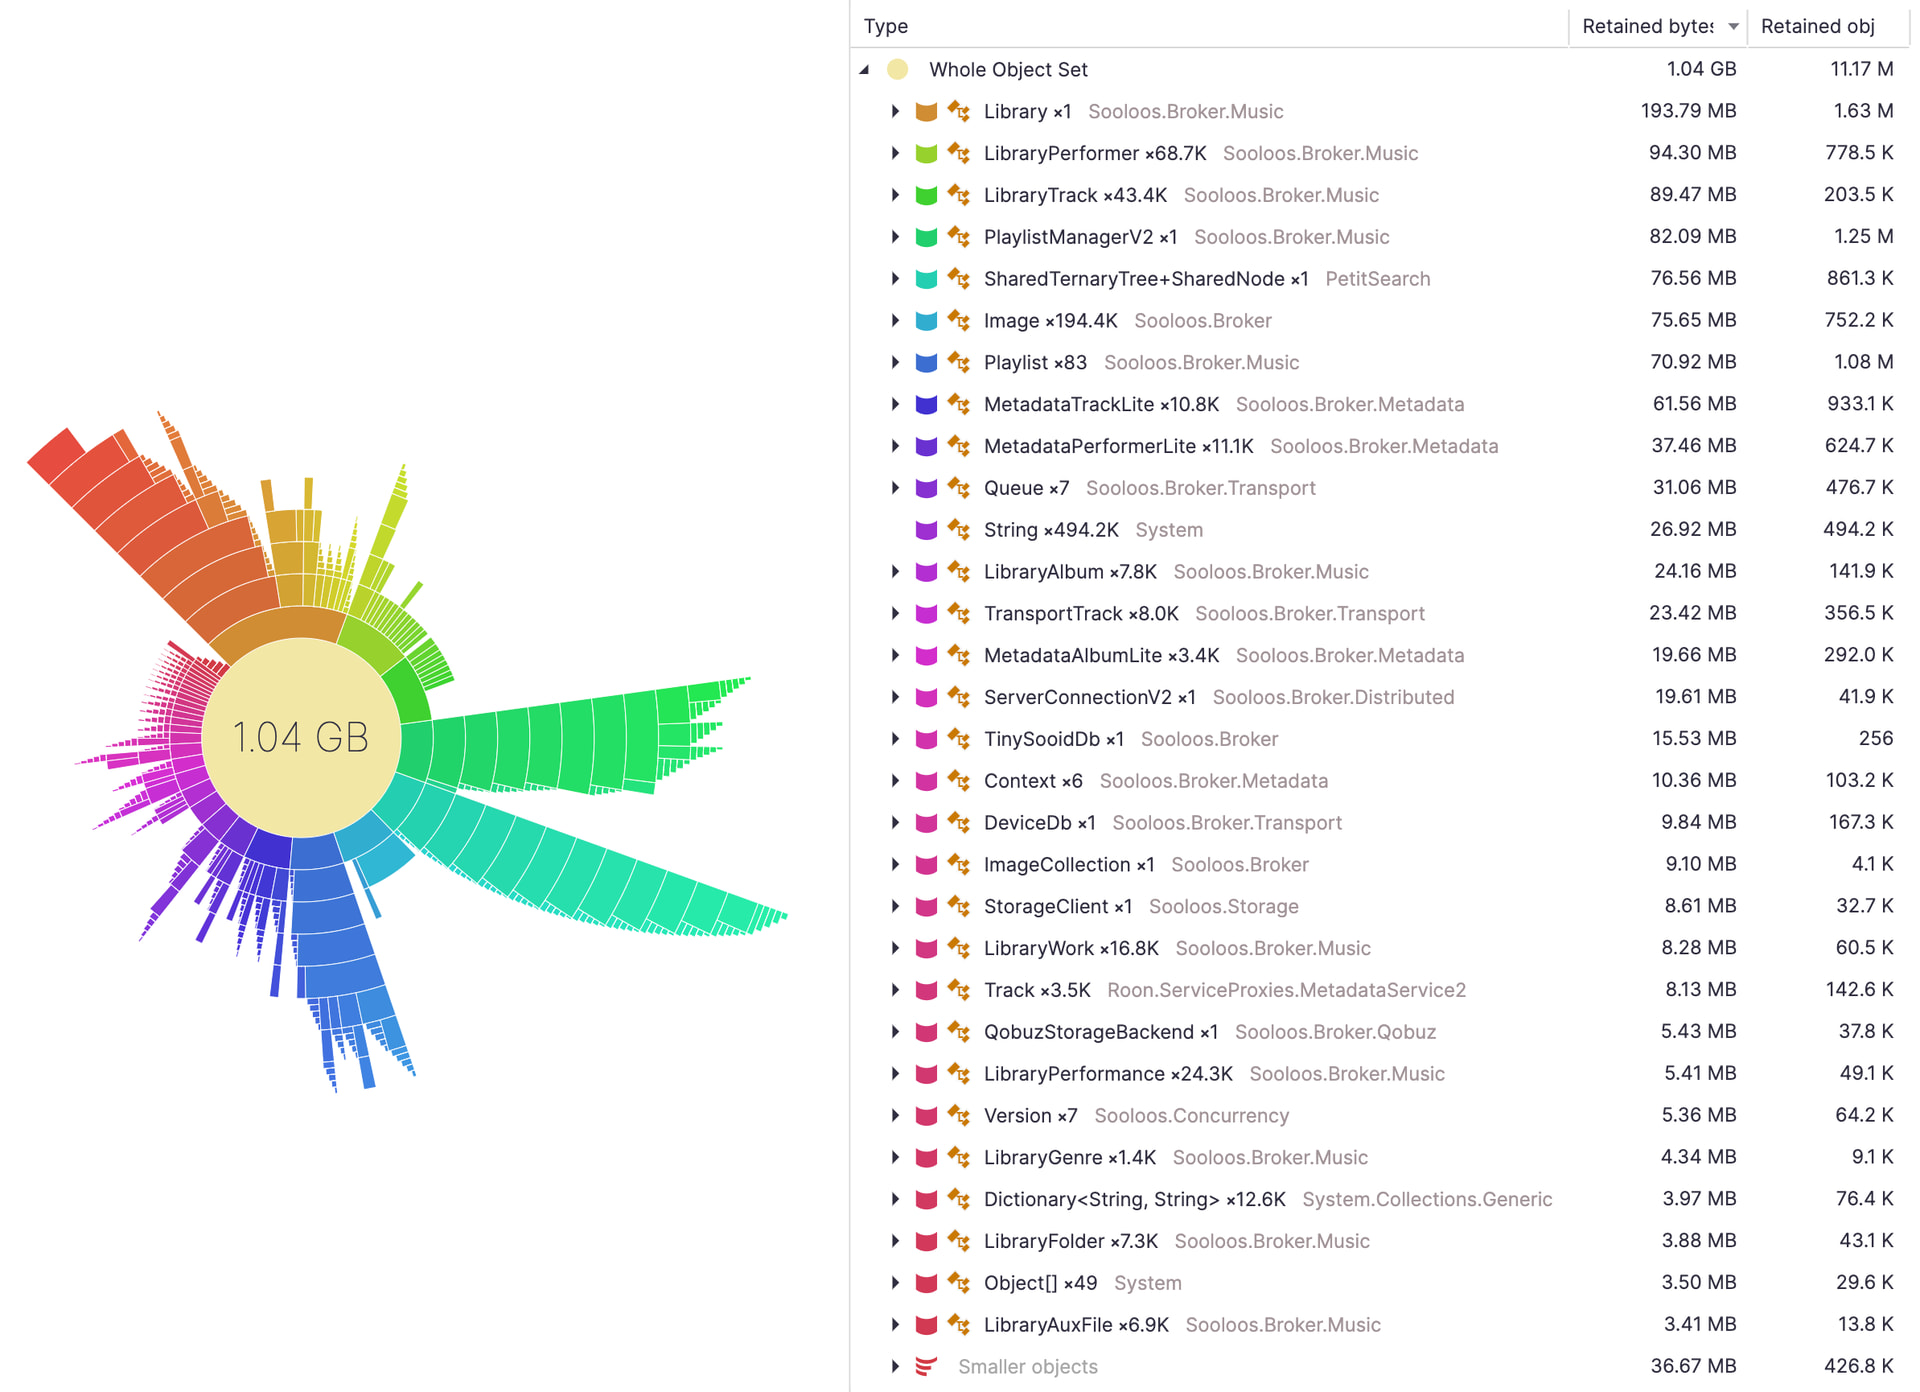
Starburst diagram showing largest “rooted” objects in memory
My Takeaways
- Roon’s memory pressures are real.
- Roon gets slower due to increasingly longer garbage collection pauses.
- Full garbage collection is expensive and pauses code execution in all threads for a relatively long time.
- Threads are waiting for a lock to acquire or a request to finish which occasionally causes network connections to fail and Roon does not recover gracefully (depends on the scenario).
- Short term solution is to restart Roon.
- Long term solution is in the hands of the Roon dev team and they’re making incremental improvements with each early access build.
I think this brings my tinkering to an end ![]() I have more respect for what Roon is and how it does what it does compared to when I started this exercise. Don’t let AI’s negative tone detract from Roon’s many merits!
I have more respect for what Roon is and how it does what it does compared to when I started this exercise. Don’t let AI’s negative tone detract from Roon’s many merits!
If you’ve made it this far, you deserve a cookie!