High CPU even when not playing

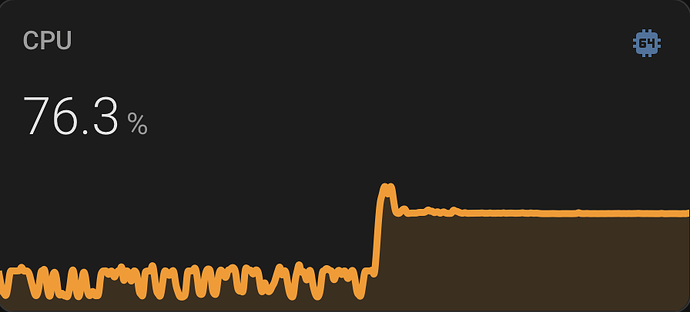
I am new to Roon, only been installed a few days. I have the latest server version installed with Ubuntu on an 4 core i3 NUC. It has 32G of RAM with an SSD. Music is on a NAS (about 1000 local albums and a few hundred Tidal). The last two days I’ve been listening all day. While running all day yesterday and today, the CPU never went above 25%. However, at the end of both days, the CPU spiked to 76% and stayed flat even when I stopped play. It’s basically using 100% of 3 cores. It’s been high for 3 hours now. The attached graph covers 6 hours.

After several hours last night, I rebooted the server, and the CPU went back down. As you can see, it stayed fine all day today, but it’s now spiked up.

What is it doing?

FYI, “background audio analysis” and “on-demand audio analysis” are both set to throttled. These audio scans completed over the weekend.

Another datapoint: My Unify system shows the Roon Server is barely touching the network (a few kb/sec – no where near enough to justify 3 cores in use). Disk i/o is almost zero as well. It’s the just the CPU chugging away on something in memory.

I did not play anything after 5pm last night, and the CPU stayed pegged at ~76% until 11pm when I rebooted the server. After the reboot, it went back to <5% and stayed there all night.

Another datapoint: If no transcoding is happening, then CPU on the NUC runs <5%. The above graph represents me streaming all day to the Sonos in my office. The max Sonos can handle is 24bit/48khz. Most of the tracks in the playlists I was using were >48khz, so some transcoding had to happen.

I used to use this NUC as a Plex video server. It may only be an i3, but it could transcode 3 4k streams – 4 if I wanted to swamp it. Then again, that was using hardware transcoding. I suspect the audio transcoding is pure CPU, no GPU.

Hi Dave a number of us have reported this and commented on multiple threads about.
It seems to be related to Metadata updates and on my 8 core i5 Nuc10 it seems to take two full cores. Normally it will stop on its own but sometimes not.

If your setup is new I would check in settings → Library and make sure it is not doing analysis of some kind. It will normally be quite obvious if it is, and best to let it complete that process and then see how it looks after that

Yeah, I saw multiple posts around CPU usage, but they seemed to be different from what I’m seeing. For the two examples you showed:

  • I’m not seeing it crash, and memory usage increases slightly. Even with the increase, memory is still <10%.
  • Even when the CPU gets high, the UI still works, and I can still play music. However, once the CPU spikes, it stays there for hours – how many hours I don’t know since I never let it go longer than 6h. I don’t want to cook my older NUC.

As a software developer, my gut tells me a transcoder thread gets stuck in a loop and burns 100% of 3 cores. That would explain the high and steady CPU and virtually no disk or network activity. I may have been taking advantage of discovering new artists/albums which meant stopping and starting many tracks quickly. Hard to say since I wasn’t watching the NUC’s CPU the whole time. I only noticed Monday night because I happened to be down in the basement near the NUC, and I heard the fan going full speed. That generally is a very rare occurrence, even when this NUC was a Plex video server.

Roon runs at seemingly random moments background housekeeping jobs on the server. One of these processes is related to metadata updates, others are database storage updates for Tidal and Qobuz content, and there may possibly be more…

During several years of running Roon on Ubuntu and monitoring the log files, I have seen how these processes are extremely demanding on the CPU and will execute much more slowly on a Roon server which has been running for several days, than on a recently restarted server.

This has been repeatedly reported to Roon support staff, without ever receiving any meaningful acknowledgement.

What I would recommend you to do is tailing the Roon server log, which will allow you to correlate logged Roon server activity with the heavy CPU usage you experience. Then you can try and demonstrate this correlation to Roon support in a corresponding support thread. You’ll find the logs in /var/roon/RoonServer/Logs

Good luck!

1 Like

If I see another spike, I will tail that log. Still 100% of 3 cores over 6+ hours seems awfully excessive just for metadata updates. Not to mention I saw little disk and network activity. I would suspect metadata updates to show network and disk traffic. Other housekeeping tasks should at least show disk I/O somewhere.

Again though. The disk on my NUC has a total of ~16GB disk used. I understand Roon can be a bit CPU heavy, but that is a crazy amount of CPU when you consider the disk and network are barely being touched.

I’ll second the above it’s metadata trawling which it does after adding files can often max out a single core of the cpu as most functions in Roon are run on one core only, but if you are new to Roon and just added a library of music it does need to complete its audio analysis as well which is a form of transcoding. It reads each file to extract dynamic range so it can display it and create the little waveform . This process is very heavy and dependant on library size can take a long time to process days for large libraries. It can be turned off in settings/library and toggle background analysis to off or throttled will do it in downtime. This process will use a set amount of cores dependent on the setting. If off it will do it on demand when playing instead which is the setting below.

What you’re experiencing is how Roon runs when you first add a large amount of data to it. It’s quite normal except the metadata issues we have mentioned. As your seeing multiple cores it will be analysis taking those up.

I had during many months a terminal session open into my Roon server, continually logging and monitoring Roon’s logs… Things were much worse some years ago, when Roon on Linux was still running on Mono… They later did some more server optimization work, but these background processes still can bring a server to a halt… I was running a server with >300k tracks, what adds to the total processing time of these processes… At times they ran for many hours, affecting the response time of any Roon user interaction…

It’s no big deal to ssh into your Roon server and to tail the log file for some days; you will find out for yourself how Roon’s server process behaves during normal use, with and without running the mentioned background processes.

I agree that Roon’s CPU usage is excessive, and this is one of several reasons why I am not running Roon anymore.

CrystalGipsy,
My local library is about 1000 albums, plus another 150 or so from Tidal. When I first set things up, I cranked up “background audio analysis speed” to 3 cores, and I had “On-demand audio analysis” set to fast until it got through my entire library. I installed Roon on Friday, and it was done by Sunday morning when I woke up. Once complete, I set both back to throttled.

What is strange with this is that if it was metadata updates, I should see disk I/o or network usages, and I see neither. The RoonAppliance process jumps to 300% (3 cores) and stays pretty constant for 6+ hours. I don’t know how long it would have gone since I rebooted the server before I went to sleep.

Andreas_Philipp1,
Being the nerd that I am, I will be checking those logs early and often. :slight_smile: I get a little bit of CPU elevation, but no way simple metadata updates can consume 3 cores for that long. Not to mention I should see disk and network activity if that is what it was doing. This little NUC can transcode multiple HD video streams in software (4k UHD requires hw help) with less CPU impact that I see Roon requiring.

Dave

All is speculation, while you can’t pinpoint in the logs what the server is doing during these CPU utilization spikes…

If it’s metadata updates it will be metadatasrv that you see in logs. Do you have a spinning circle or red triangle in the top right of Roons UI?

Right now, things are operating normally. During the 3 core CPU usage, I did not see a spinning circle or a red triangle. The app seemed to be working normally (just a bit slower) on both a Mac and an iPad.

1 Like

the big meta service updates are every few days I think, the time they kick off seems a bit random and sometimes they just trigger. Be interesting to see if its this as this has affected a number of us on Linux and other platforms but others not. I do think its tied to their cloud services as if they get a blip Roon gets slow and in odd states as It reliies so much on cloud stuff.

I have seen it happen even when no music is playing, so I doubt it is the audio decoding or transport processes.

You might not see much network or disk activity because Roon isn’t receiving metadata. My understanding is that during these sessions Roon tries to identify every unidentified album, which can be futile.

Roon should allow the user to tell Roon to stop trying to identify individual albums.

As soon as I stopped playback, the CPU jumped from <10% to 26-28% with RoonAppliance using 100% or one core. The log is full of what looks like stats calls to check on a directory:

12/04 18:07:38 Info: [7] [stats] 7099mb Virtual, 2302mb Physical, 889mb Managed, 405 Handles, 85 Threads
12/04 18:07:47 Debug: [.NET ThreadPool Worker] [easyhttp] [8796] POST to https://api.roonlabs.net/device-map/1/register returned after 124 ms, status code: 200, request body size: 9 KB
12/04 18:07:47 Trace: [Broker:Misc] [devicemap] device map updated
12/04 18:07:53 Info: [7] [stats] 7099mb Virtual, 2302mb Physical, 909mb Managed, 405 Handles, 85 Threads
12/04 18:08:08 Info: [7] [stats] 7067mb Virtual, 2302mb Physical, 888mb Managed, 405 Handles, 77 Threads
12/04 18:08:23 Info: [7] [stats] 7019mb Virtual, 2302mb Physical, 903mb Managed, 405 Handles, 71 Threads
12/04 18:08:37 Info: [Broker:Media] [library stats] tracks: 15235 (hidden: 24), albums: 1148 (hidden: 2), artists: 728, works: 9253, performances: 10680
12/04 18:08:38 Info: [7] [stats] 7107mb Virtual, 2302mb Physical, 887mb Managed, 405 Handles, 86 Threads
12/04 18:08:53 Info: [7] [stats] 7107mb Virtual, 2302mb Physical, 862mb Managed, 405 Handles, 86 Threads
12/04 18:09:08 Info: [7] [stats] 7035mb Virtual, 2302mb Physical, 915mb Managed, 405 Handles, 73 Threads
12/04 18:09:23 Info: [7] [stats] 7003mb Virtual, 2302mb Physical, 856mb Managed, 405 Handles, 73 Threads
12/04 18:09:38 Info: [7] [stats] 7099mb Virtual, 2302mb Physical, 844mb Managed, 405 Handles, 85 Threads
12/04 18:09:53 Info: [7] [stats] 7099mb Virtual, 2302mb Physical, 869mb Managed, 406 Handles, 85 Threads
12/04 18:09:53 Debug: [.NET ThreadPool Worker] [easyhttp] [8797] POST to https://api.roonlabs.net/device-map/1/register returned after 127 ms, status code: 200, request body size: 9 KB
12/04 18:09:53 Trace: [Broker:Transport] [devicemap] device map updated
12/04 18:10:08 Info: [7] [stats] 7035mb Virtual, 2302mb Physical, 917mb Managed, 406 Handles, 73 Threads
12/04 18:10:23 Info: [7] [stats] 7011mb Virtual, 2302mb Physical, 858mb Managed, 406 Handles, 70 Threads

Settings → Storage says “Watching for new files in real time…”

This seems way excessive to be checking for new purchased files 24x7. I get scanning periodically, but constantly seems a bit much. Exactly how many and how often is Roon expecting me to purchase new music?

These [stats] log entries started as soon as I stopped playback. You can see how steady the CPU gets. If I start playback again, the CPU builds on top this new floor. It’s only a guess, but I think my previous issue was there were multiple scans happening.

Finally, if I reboot, the CPU goes down to <5% and stays there.

Is there any way to turn off the constant scan given I might add a new album every few months? If not, then I will most likely not continue after my 3 month trial ends. This is a waste of power and extra wear on my NUC and NAS.
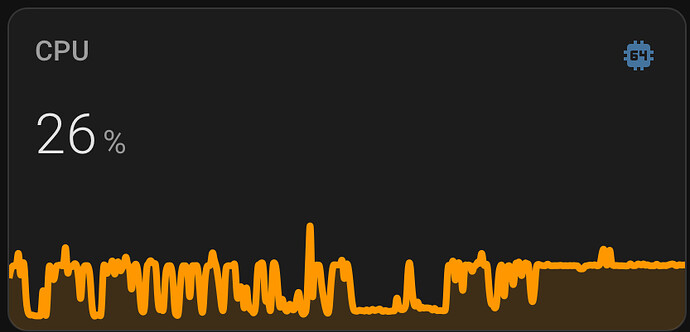
Mine doesn’t use that much even with upsampling on my 11i7 not a nuc though… Something is triggering it all the time. You can’t turn it off or set a time unless it’s network storage it’s realtime monitoring for local disk.

Where is your music located local disk or on a NAS if nas it will check if it’s connected pretty much all the time from what I remember.

The log really doesn’t give any hints… the server isn’t really logging any running processes… just every 15 seconds the usual used resources statistics… memory use is stable, and so is the file handles count…

I don’t think this CPU usage spike is because of the process which is watching the directory with your local files… Something different must be going on…

I think it’s time to open a Support thread to have Roon support staff look into this. Would be good to take some screen shot of htop showing RoonAppliance driving one core at 100%, all the while there’s nothing showing up in the logs…

Agreed. I rebooted, and log looks basically the same. Only change is that my CPU is now <5%.

Now I’m starting to wonder if it’s something to do with playback to a Sonos device over a long period. This is while I work, so it was about 9 hours of continuous play, mostly from Tidal playlists. My main listening area is a Roon Ready device into a McIntosh Preamp/DAC, separate amp, etc, but I don’t get 8-9 hour listening sessions there often, if at all. :slight_smile:

I guess I will try again tomorrow, and bring something up with Roon Support if it happens again.