Monitoring containers using Glances and Grafana

I’ve had a quick play and spun up containers for Glances, InfluxDB, and Grafana, which are all running. But, getting communication with InfluxDB working is proving a challenge – getting unauthorized message.

Any tips?

PS. If this gets a little off-topic, I’ll create a linked topic for setting up the containers.

I’m happy to help with this but let’s create a new thread if you have additional questions.

I used these two sources:

I set this up a year or so ago and I recall having issues with a couple of things. I recall there being a couple of bugs in the Grafana dashboard template, I don’t recall the other.

It’s a complicated stack.

You need to get the Glances → InfluxDB pipe working. This is what you see in the glances service definition below and also configuration in the glances.conf file in the [influxdb2] section. There’s an [influxdb] section, too. I’m running InfluxDB2, so that’s the section I modified and it needs to be populated with the right org, bucket, and token. If you get that part right, your data will flow into InfluxDB2.

Then you need an influx-configs file that specifies a correct URL (localhost:port), the same token that’s in the Glances config, and the same org in the Glances config.

You need all the Secrets files below, too.

I believe there may be additional configuration in Grafana where you point it at an InfluxDB2 source. And then you have to fix the dashboard.

You’ll see below that I use macvlan and per-service IPs. You can do this with everything on the same IP and just map the ports you need.

The IPs below are non-routable and are not PII. You don’t have to worry about them being posted.

This really is a pain to set up. I wish I knew an easier approach. Maybe @scidoner can tell us more about what they do.

version: "3.2"
services:
  glances:
    container_name: roon-telemetry-glances
    hostname: m-t-glances
    image: nicolargo/glances:dev
    restart: unless-stopped
    environment:
      # with influxdb and Grafana as interface
      - GLANCES_OPT=-q --export influxdb2 --time 10
    pid: "host"
    privileged: true
    networks:
      macvlan_network:
        ipv4_address: 192.168.20.43
    depends_on:
      - influxdb2
    volumes:
      - /var/run/docker.sock:/var/run/docker.sock:ro
      - /mnt/apps/appdata/roon-telemetry/cfg/glances/glances.conf:/etc/glances/glances.conf
  
  influxdb2:
    container_name: roon-telemetry-influxdb2
    image: influxdb:2

    restart: unless-stopped
    environment:
      DOCKER_INFLUXDB_INIT_MODE: setup
      DOCKER_INFLUXDB_INIT_USERNAME_FILE: /run/secrets/influxdb2-admin-username
      DOCKER_INFLUXDB_INIT_PASSWORD_FILE: /run/secrets/influxdb2-admin-password
      DOCKER_INFLUXDB_INIT_ADMIN_TOKEN_FILE: /run/secrets/influxdb2-admin-token
      DOCKER_INFLUXDB_INIT_ORG: nicolargo
      DOCKER_INFLUXDB_INIT_BUCKET: glances
      INFLUXD_HTTP_BIND_ADDRESS: 192.168.20.44:8086
    secrets:
      - influxdb2-admin-username
      - influxdb2-admin-password
      - influxdb2-admin-token
    volumes:
      # Data persistency
      # sudo mkdir -p /srv/docker/influxdb2/data
      - /mnt/apps/appdata/roon-telemetry/data/influxdb2:/var/lib/influxdb2
      - /mnt/apps/appdata/roon-telemetry/cfg/influxdb2:/etc/influxdb2
    networks:
      macvlan_network:
        ipv4_address: 192.168.20.44
  
  grafana:
    container_name: roon-telemetry-grafana
    image: grafana/grafana
    restart: unless-stopped
    user: "1000"
    volumes:
      - /mnt/apps/appdata/roon-telemetry/data/grafana:/var/lib/grafana
    networks:
      macvlan_network:
        ipv4_address: 192.168.20.45

secrets:
  influxdb2-admin-username:
    file: /mnt/apps/appdata/roon-telemetry/secrets/influxdb2-admin-username
  influxdb2-admin-password:
    file: /mnt/apps/appdata/roon-telemetry/secrets/influxdb2-admin-password
  influxdb2-admin-token:
    file: /mnt/apps/appdata/roon-telemetry/secrets/influxdb2-admin-token

networks:
macvlan_network:
external:
name: macvlan_default

1 Like

Sure thing - I am running Zabbix. My entire infrastructure is monitored with it - network (including load balancers) via SNMP templates and Windows and Linux via their v2 agent. VMware via vSphere is also connected.

Docker containers are natively supported by the Zabbix v2 agent, so its just a matter of adding the template to the docker nodes and Zabbix does the rest.

Zabbix old school charts aren’t as pretty as Grafana but boy was it simpler to stand up :smiley:


Regarding the issue at hand, it has started to be an absolute turd again (as expected) so I have capped the container upper memory limit and we will see what happens from here.

I wonder if that may be an easier start for @mjw. What I’m doing isn’t easy to replicate. At least for single-machine monitoring of containers, Zabbix may be more turnkey.

Here’s 6 hours worth of prod vs. EA. They’re virtually indistinguishable. Check out those synchronized CPU spikes, though. Makes you wonder if they’re doing something like syncing Qobuz based on clock time intervals which would basically turn Roon into a DDOS attacker. Hmmmm…

1 Like

Creating a pod was relatively straightforward. The problems I have are twofold:

  1. I can’t see any data in Influx from Glances
  2. Grafana won’t connect to Influx

Here’s how I provisioned things.

podman pod create --replace --name glances \
  --infra-name pod-glances \
  -p 8086:8086 \
  -p 3000:3000
    
podman create --replace --pod glances \
  --name glances-influxdb \
  --restart=unless-stopped \
  -e DOCKER_INFLUXDB_INIT_MODE=setup \
  -e DOCKER_INFLUXDB_INIT_USERNAME=<user> \
  -e DOCKER_INFLUXDB_INIT_PASSWORD="<password>" \
  -e DOCKER_INFLUXDB_INIT_ORG=ateles \
  -e DOCKER_INFLUXDB_INIT_BUCKET=glances \
  -e DOCKER_INFLUXDB_INIT_RETENTION=1w \
  -e DOCKER_INFLUXDB_INIT_ADMIN_TOKEN="<secret>" \
  -v "/home/martin/.config/containers/influxdb/data:/var/lib/influxdb2" \
  -v "/home/martin/.config/containers/influxdb/config:/etc/influxdb2" \
docker.io/library/influxdb:2
    
podman create --replace --pod glances \
  --name=glances-grafana \
  --restart=unless-stopped \
  -v "/home/martin/.config/containers/grafana/data:/var/lib/grafana" \
docker.io/grafana/grafana
    
podman create --replace --pod glances \
  --name glances-server \
  --restart=unless-stopped \
  -e GLANCES_OPT="-q --export influxdb2 --time 10" \
  -v /run/user/1000/podman/podman.sock:/run/user/1000/podman/podman.sock:ro \
  -v /home/martin/.config/containers/glances/config:/etc/glances \
  --pid host \
  --requires glances-influxdb \
docker.io/nicolargo/glances:ubuntu-latest-full

I think I’ll remove all host data, and try again with the development branch of Glances.

It’s been a long time since I set this up. I’m glad you caught that I’m using the dev branch of Glances. I recall needing to switch to that branch.

You’re looking at this the right way - start by getting Glances running and pushing data into InfluxDB.

A few additional things:

  • Your influxdb instance uses an org of ateles. Have you also set up the glances “.config” file and made sure that the org specified there is “ateles”? This is how you establish agreement between glances and influx on the bucket name

  • You’ve specified data retention of 1w. That seems short to me. Influx will delete everything older than a week. You can easily set the retention in InfluxDB2 - once you’re able to log into the WebUI, it’s just a settiing on the bucket. Personally, I’d take it out of this script, let it start at “forever” and adjust it later if you find your InfluxDB is getting larger than you want it to

  • I’m not sure how you’re setting up the InfluxDB username/password/admin token. The admin token is very important and may be the source of your issue. Username and Password are the credentials you’ll use to log into the InfluxDB web UI. It sounds like you may already be able to do that. The admin token is the token that Glances will use as its credential. It’s set in Glances’ config file in the InfluxDB2 section but you also have to set the same value for InfluxDB2.

My approach uses secrets using Docker compose’s “secrets” capabilities. Since you’re not using secrets files, you should probably just use the values you want to use directly in your podman commands. So rather than than use , , , use the actual quoted literals that you want to use. And then make very sure that the value you’re passing to InfluxDB2 as the admin token is the exact value that you’ve got in your Glances confg.

I hope that all makes sense. I wish I believed that this is the last of your troubles. It isn’t. But you’re on the right track :slight_smile:

1 Like

Well, this seemed to be the crucial change. I’ve not gone any further than seeing this:

This looks promising, I will load the dashboard after dinner duties, before posting another update.

Thanks for the assistance @gTunes and @scidoner.

1 Like

How did you address the secrets issue?

I wonder if I should try to get you an exported copy of my Grafana dashboard. I can’t remember what the issues I fixed were or how I fixed them. If you run into trouble with the Grafana display, I can try to do that.

1 Like

I noticed that ~/.config/containers/influxdb/config/influx-configs had a unique admin token, so I copied this to the relevant Podman script environment variable. Likewise, for the InfluxDB username and password, I did the same.

To add the dashboard was simplicity itself. I simply clicked on Add under Dashboards, and typed 23211 in the appropriate field.

Here’s my revised documentation steps.

PASSWORD="<pasword>"
ADMIN_TOKEN="<token>"

mkdir -p $HOME/.config/containers/influxdb/data
mkdir -p $HOME/.config/containers/influxdb/config
mkdir -p $HOME/.config/containers/grafana/data
mkdir -p $HOME/.config/containers/glances/config

podman pod create --replace --name glances \
  --infra-name pod-glances \
  -p 8086:8086 \
  -p 3000:3000
    
podman create --replace --pod glances \
  --name glances-influxdb \
  --restart=unless-stopped \
  -e DOCKER_INFLUXDB_INIT_MODE=setup \
  -e DOCKER_INFLUXDB_INIT_USERNAME=admin \
  -e DOCKER_INFLUXDB_INIT_PASSWORD=$PASSWORD \
  -e DOCKER_INFLUXDB_INIT_ORG=ateles \
  -e DOCKER_INFLUXDB_INIT_BUCKET=glances \
  -e DOCKER_INFLUXDB_INIT_RETENTION=8w \
  -e DOCKER_INFLUXDB_INIT_ADMIN_TOKEN=$ADMIN_TOKEN \
  -v "$HOME/.config/containers/influxdb/data:/var/lib/influxdb2" \
  -v "$HOME/.config/containers/influxdb/config:/etc/influxdb2" \
  --stop-timeout=90 \
  --health-cmd='["curl", "-f", "http://localhost:8086"]' \
  --health-retries=5 \
  --health-start-period=60s \
  --health-timeout=10s \
docker.io/library/influxdb:2
    
podman create --replace --pod glances \
  --name=glances-grafana \
  --restart=unless-stopped \
  -v "$HOME/.config/containers/grafana/data:/var/lib/grafana" \
  --stop-timeout=90 \
  --health-cmd='["curl", "-f", "http://localhost:3000"]' \
  --health-retries=5 \
  --health-start-period=60s \
  --health-timeout=10s \
  --requires glances-influxdb \
docker.io/grafana/grafana
    
podman create --replace --pod glances \
  --name glances-server \
  --restart=unless-stopped \
  -e GLANCES_OPT="-q --export influxdb2 --time 10" \
  -v /run/user/1000/podman/podman.sock:/run/user/1000/podman/podman.sock:ro \
  -v $HOME/.config/containers/glances/config:/etc/glances \
  --health-cmd='[ -n "$(ps -aux | grep glances)" ]' \
  --health-retries=5 \
  --health-start-period=60s \
  --health-timeout=10s \
  --pid host \
  --requires glances-influxdb \
docker.io/nicolargo/glances:ubuntu-dev

The only outstanding task is to create systemd files, so it all starts at boot.

cd ~/.config/systemd/user
podman generate systemd --new --files --name glances
systemctl --user daemon-reload
systemctl --user start pod-glances.service
systemctl --user is-active pod-glances.service
active

systemctl --user enable pod-glances.service
Created symlink /home/martin/.config/systemd/user/default.target.wants/pod-glances.service → /home/martin/.config/systemd/user/pod-glances.service.

All done!

Now, let’s wait for some metrics, and return to the discussion in …

2 Likes

After rebuilding my server, I had a few issues with Glances and Grafana caused by incomplete documentation.

The critical point is that the Glances container does not create glances.conf, and this has to be manually edited and copied to the config volume (I’d forgotten this and had to look at the logs for pointers.) The other point is that Flux is the query language.

Anyway, I’m back up and running again.

Incidentally, the retention period in my original post was just 8 weeks. If this is changed after Systemd is set up, then the service must be disabled, the files deleted, and then recreated. Otherwise, the original value will be used a boot time.

Oh, and the latest versions of each package may be used; the development branch is not a prerequisite.

Hi, @mjw

This is longish. Sorry. I recommend a full read :slight_smile:

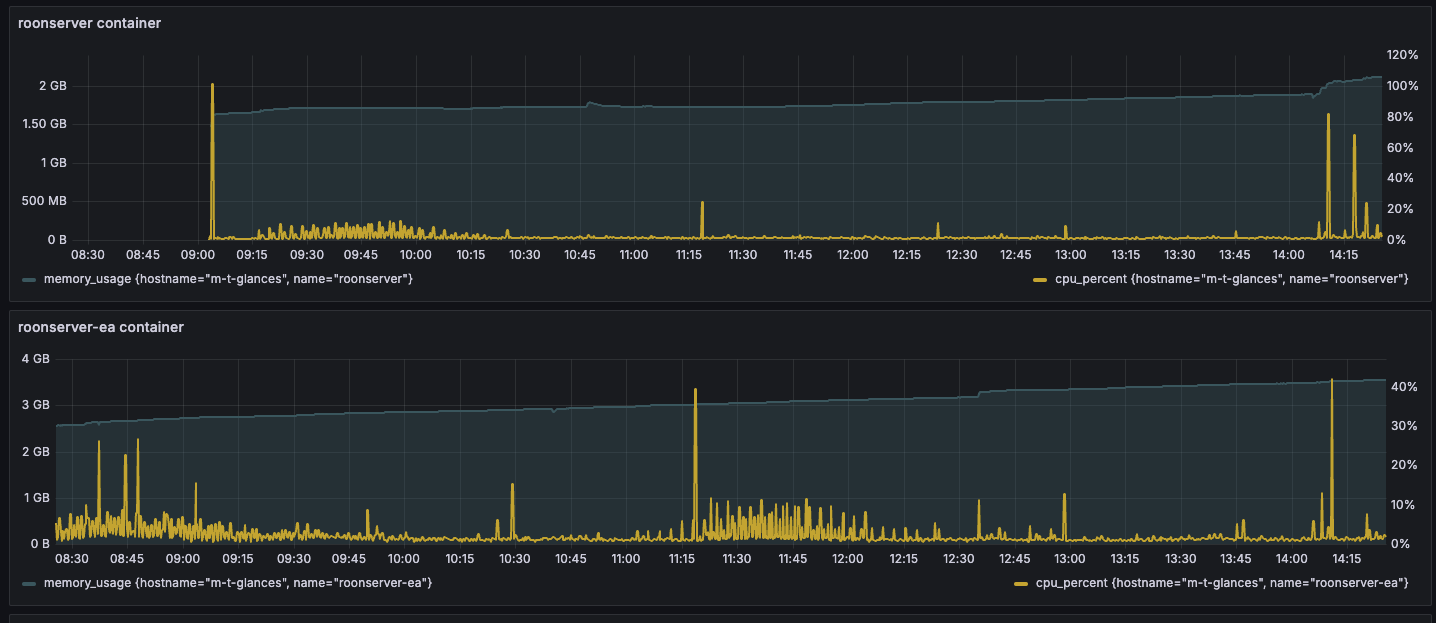
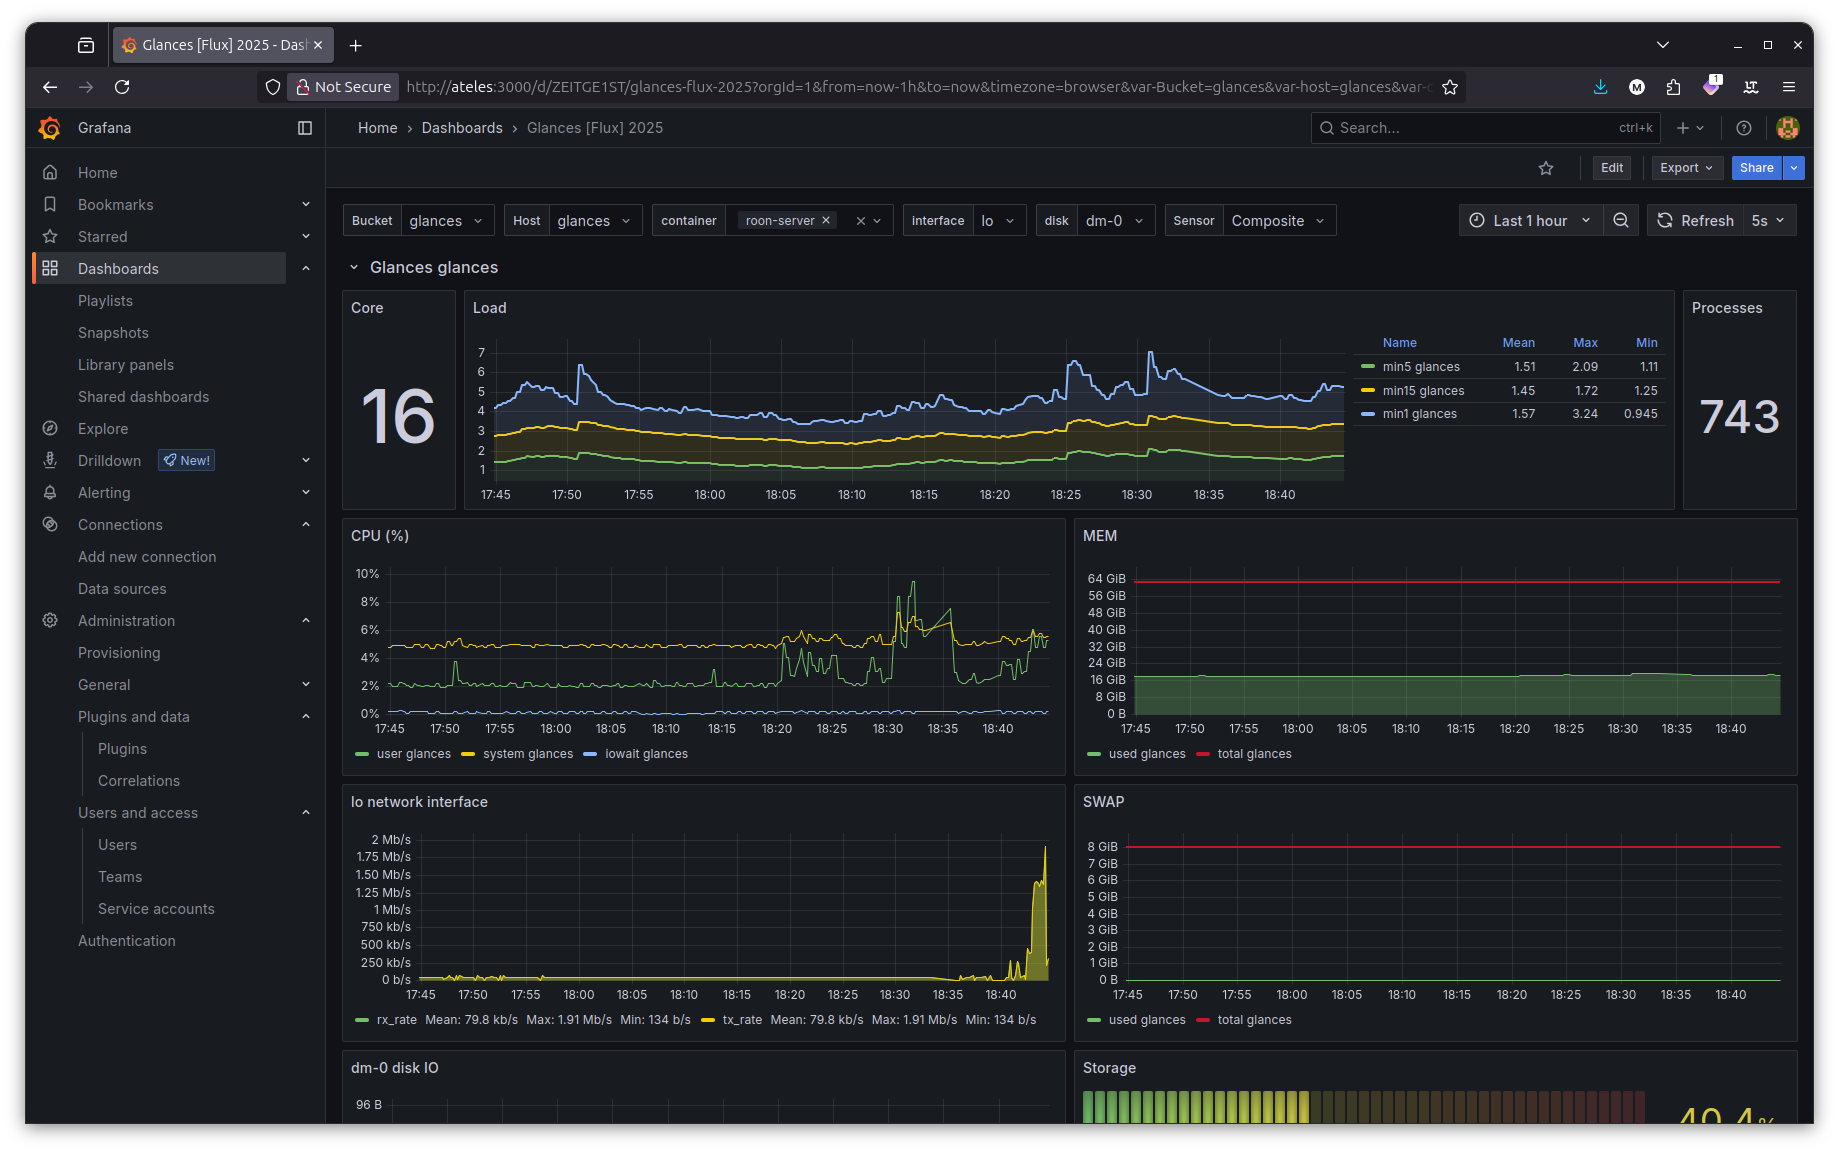
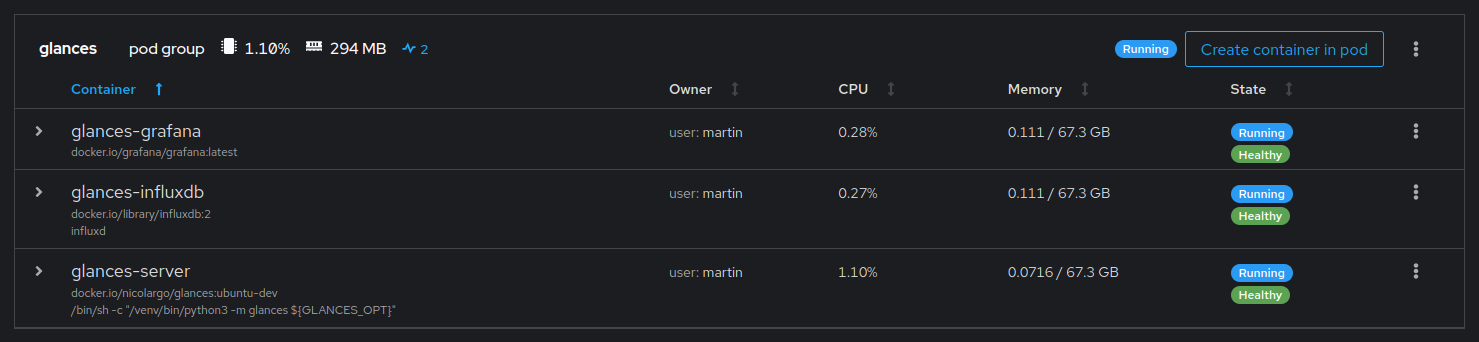
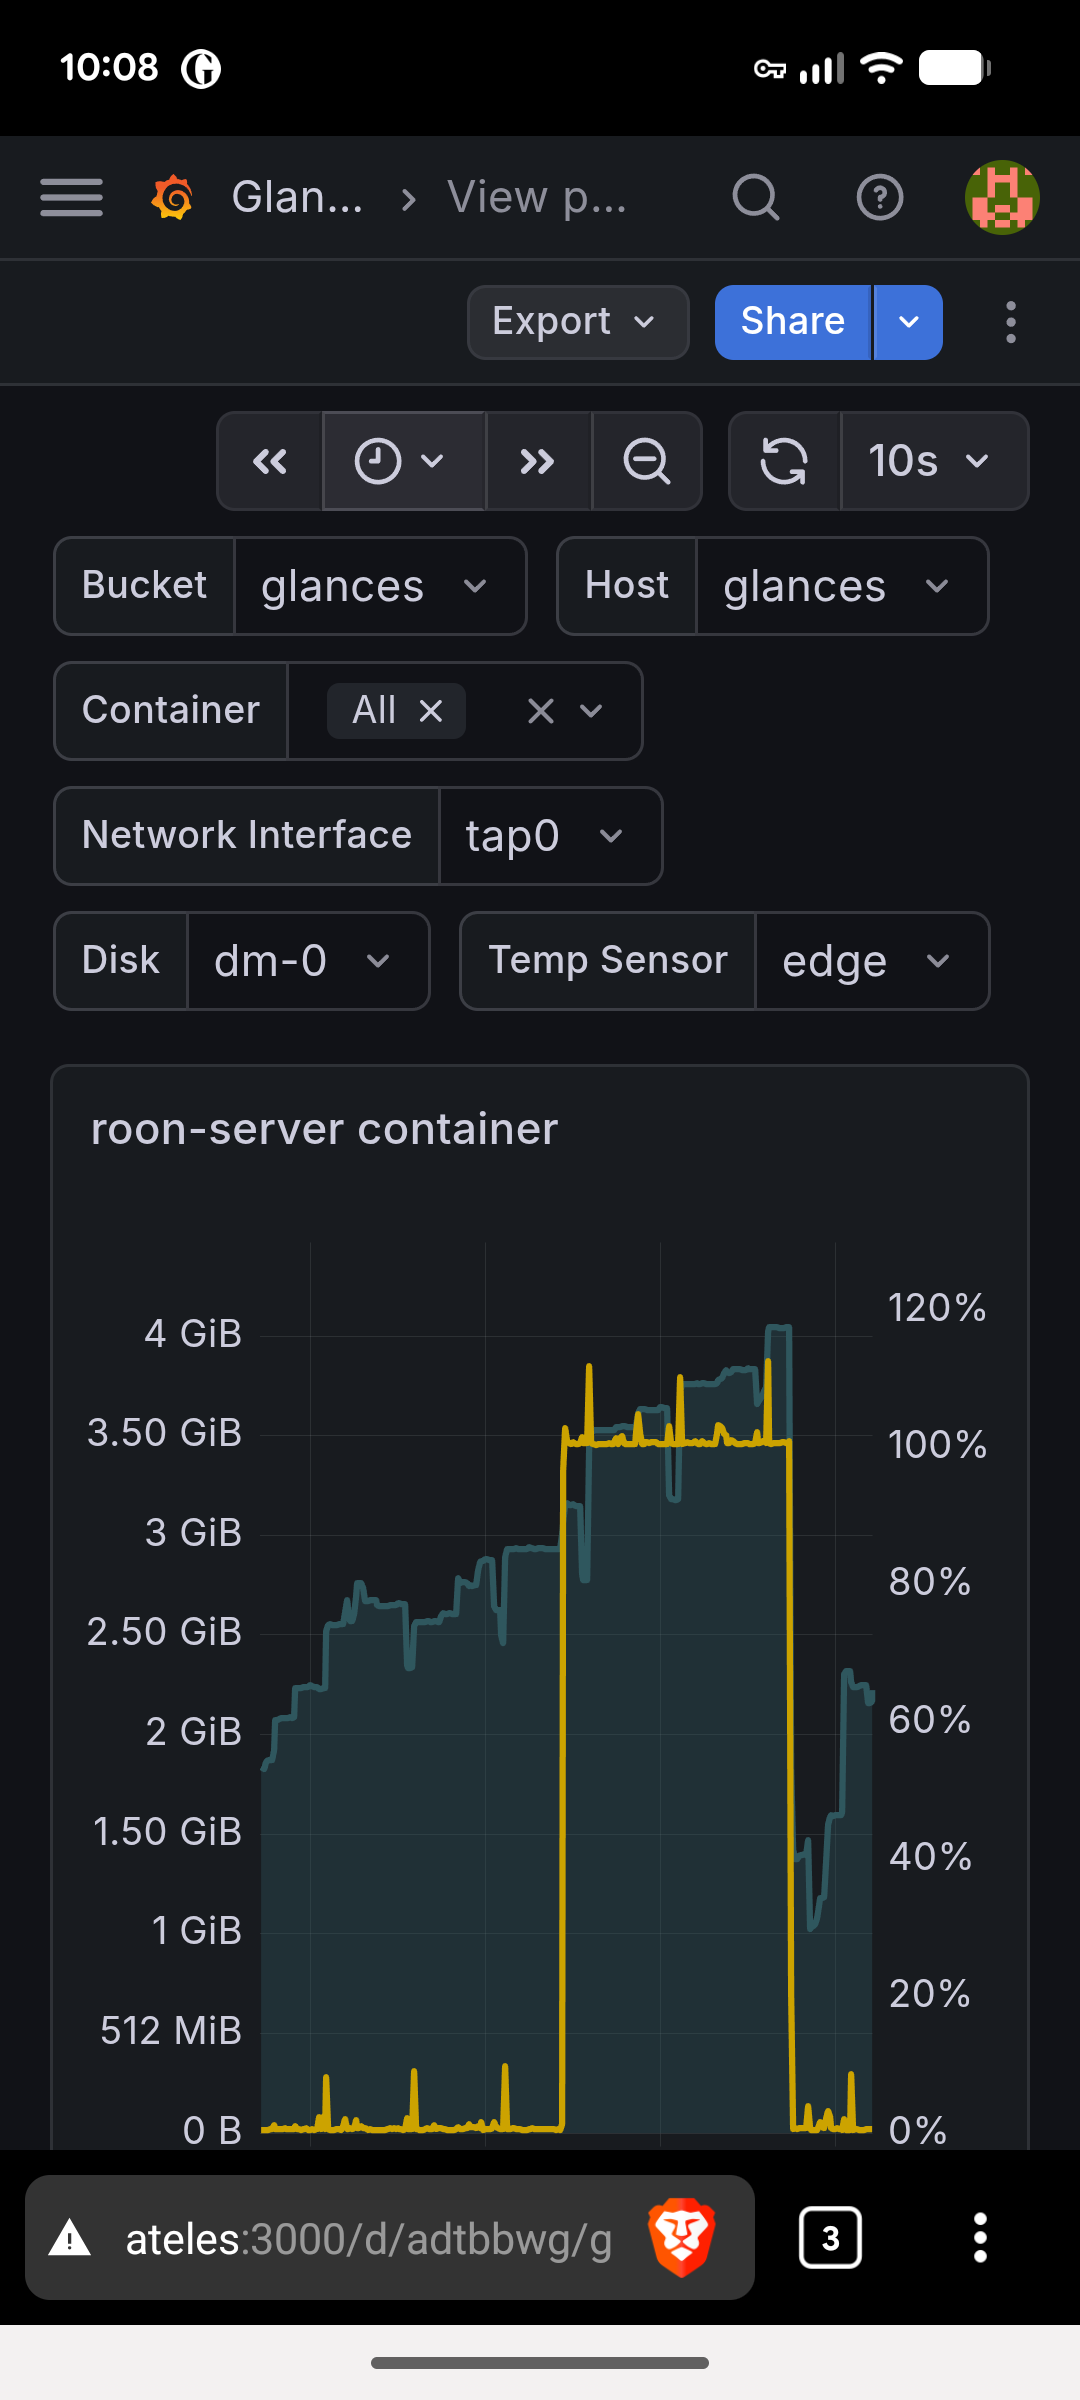
I’ve been looking at the official Roon docker container - comparing it’s characteristics to my self-built container. In the process, I saw discrepancies between container memory consumption as reported by the Docker API, what I was seeing in a version of Glances that I run to look at the TUI UI, and what I was seeing in my Grafana dashboard which based on the stack yours is, which has its own version of Glances pushing into Influx.

Here’s the short story - for reasons I don’t recall, I had the telemetry stack’s version of Glances pinned to an old version (4.4.1). As of today, Glances is at 4.5.4.

The version I was using was significantly under-reporting memory usage. It should have been reading stats from Docker and pushing them into Influx. But the value it was pushing for memory_usage was significantly low. About 500MB in the case of Roon.

This is fixed in the latest version. Moving to “nicolargo/glances:latest-full” caused that value to align with what the current version of Glances shows in the TUI and what Docker itself reports if you invoke with something like:

sudo curl -s --unix-socket /var/run/docker.sock \
  "http://localhost/containers/roonserver/stats?stream=false" | \
  jq '.memory_stats | {usage, limit, stats: {anon: .stats.anon, file: .stats.file, inactive_file: .stats.inactive_file, active_file: .stats.active_file}}'

Unfortunately, that’s not the whole story. As far as I can tell, Docker’s reported “usage” actually includes inactive memory, which is separately reported as “inactive_file”. Glances pushes a number of memory datapoints into Influx. My dashboard graphs “memory_usage” and I think yours does, too.

The problem is that this includes the portion of memory which is reclaimable page cache and, realistically, it probably shouldn’t. The “fix” is to subtract it out and graph that as “memory_usage - memory_inactive_file”.

It gets more complex, though, because the extent to which this matters is going to vary significantly by system. My system is TrueNAS with 128GB of RAM, most of which is dedicated to ZFS ARC. On this system, inactive_file appears to almost always be 0. I literally see just one instance of a non-zero value over the past day and, strangely, it’s for the Grafana container.

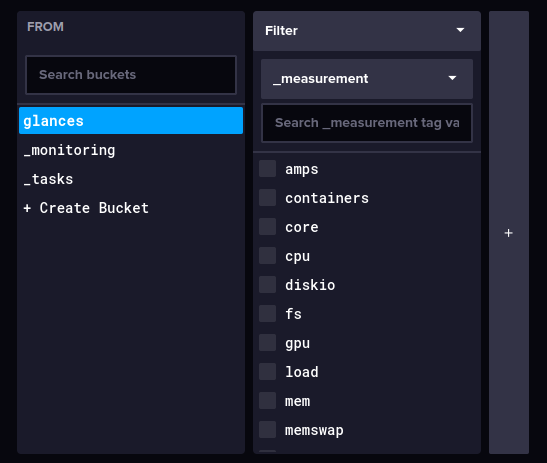
If you want to do a quick test in Influx, you can run a query like this:

from(bucket: "glances")
  |> range(start: -24h)
  |> filter(fn: (r) => r._measurement == "containers")
  |> filter(fn: (r) => r._field == "memory_inactive_file")
  |> group(columns: ["name"])
  |> max()

If you see non-zero values, the most straightforward fix would be to modify the Grafana query to subtract it out (and / or add it to the Grafana graphs).

I know that was long but I put you on this dashboard path and I feel responsible if you’ve got bad data :frowning:

@mjw messaged me on another topic and mentioned that he’s not going to be able to spend time on this at the moment.

He also mentioned that he’s using a later dashboard than the one I initially recommended. He’s using the Grafana dashboard with id 23211. He posted that back in July, 2025 but I didn’t compute that it’s a newer dashboard than what I’m using.

I compared the one I’m using with 23211. 23211, the one @mjw recommended, does the right thing with memory. For individual container graphs and the “All Containers Memory” graph, it subtracts memory_inactive_file from memory_usage (it does it defensively and handles the case where inactive_memory_files isn’t available).

The older dashboard that I was using does not do the correct thing.

I’ve now switched to 23211. It’s nicer anyhow.

1 Like

Thorough as ever, there’s nothing more for me to add.

However, I’m still seeing the container occasionally pegged at 100% for no apparent reason.

This last occurred before upgrading to 2.65. Whilst it is too early to see how the latest release performs, early indications are positive.

Incidentally, there is a marked improvement running Roon on Wine 10.0.