What app are you having the slowness issue with?
· Roon
What kind of performance/speed issue are you experiencing?
· Other
Please try to reboot your Roon Server
· Yes, rebooting helps, but the issue returns after some time
Please try to reboot your networking gear (Router/Switches/etc.)
· No, the issue is still the same even after a reboot
Is there any change in behavior if you try to navigate to Roon Settings -> Library and set both Background and On-Demand Audio Analysis to Throttled or Off?
· No, the issue is still the same
Does the issue happen on multiple Roon Remotes (controllers) or just one?
· I only have one Roon remote to test with
Please try to restart your Roon Remote (controller) app
· No, the issue is still the same even after a restart
What is the operating system of your Roon Remote (controller)?
· Mac
Reinstall Windows/MacOS Roon Remote App
· No, I am still having the issue even after reinstalling
Router Domain Name System (DNS) change
· I don't know how to do this
What is the operating system of your Roon Server host machine?
· Prebuilt Branded Roon Server (SonicTransporter, Innous, Merging...)
Timestamp of issue occurrences
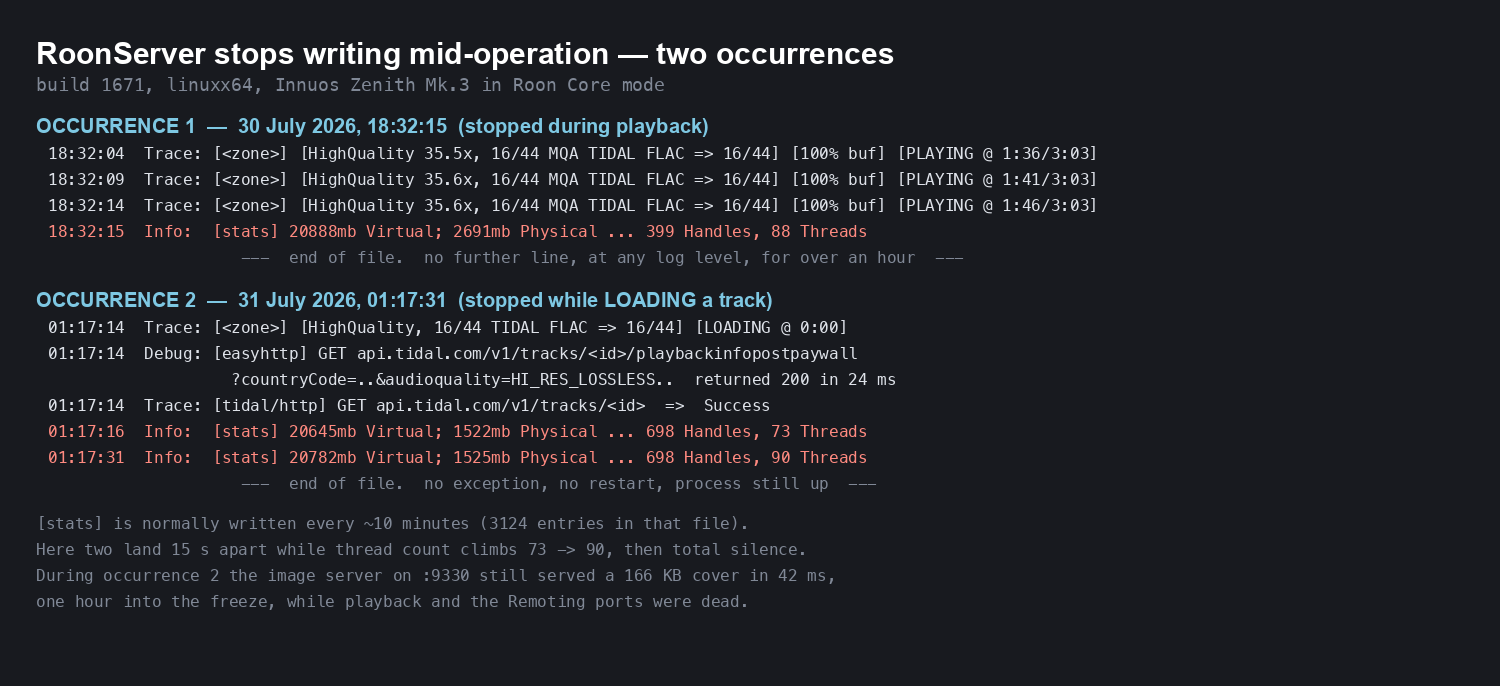
· Two occurrences, both captured server-side. The timestamps below are exactly as they appear in RoonServer_log.txt on the Core, so they should line up directly with the logs when you read them. Occurrence 1 — 30 July 2026, 18:32:15 Last log line before the silence, mid-playback: 18:32:14 [] [HighQuality 35.6x, 16/44 MQA TIDAL FLAC => 16/44] [100% buf] [PLAYING @ 1:46/3:03] 18:32:15 [stats] ... 399 Handles, 88 Threads Nothing is written after that line. In this occurrence port 9330 also stopped accepting TCP connections entirely. Occurrence 2 — 31 July 2026, 01:17:31 Freeze began while the Core was LOADING a track: 01:17:14 [] [HighQuality, 16/44 TIDAL FLAC => 16/44] [LOADING @ 0:00] 01:17:14 [easyhttp] GET api.tidal.com/v1/tracks//playbackinfopostpaywall ...audioquality=HI_RES_LOSSLESS... returned 200 in 24 ms 01:17:16 [stats] ... 698 Handles, 73 Threads 01:17:31 [stats] ... 698 Handles, 90 Threads Nothing after that. Thread count rose 73 -> 90 in fifteen seconds, and those two [stats] lines are 15 s apart instead of the usual ten-minute cadence. In this occurrence port 9330 kept serving cached images normally (a real 166 KB cover in 42 ms, an hour into the freeze) while playback and the Remoting ports were dead. I only noticed occurrence 2 at about 02:10, when music would not start; the freeze itself had begun at 01:17:31 with nobody touching the system. Recovery both times: a full restart of the appliance. After the restart that followed occurrence 1, the Core ran for exactly 5 h 42 min before occurrence 2. One caveat on clocks, so you are not misled: the appliance's timezone is set to Europe/London, while I am in Europe/Paris (CEST). If your reading of the logs needs my local wall-clock time, add one hour to the values above. The relative intervals and the log-internal sequence are of course unaffected.
Describe the issue
Hello,
RoonServer hangs on my Core roughly twice a day. I have captured server-side logs
for two consecutive occurrences and the signature is consistent, so I think this
is a deadlock rather than a crash.
SETUP
Core RoonServer build 1671, platform linuxx64
running on an Innuos Zenith Mk.3 appliance (no shell access)
Library 100% TIDAL streaming, zero local files
Remotes Roon on macOS
Endpoint Meridian Explorer² USB DAC attached to the Innuos
Network wired path, 3-9 ms to the Core, 0% packet loss measured
continuously (44 consecutive probes) around the incidents
WHAT HAPPENS
RoonServer_log.txt simply stops. No exception, no stack trace, no restart, no
further line at any log level. The process stays up and keeps its listening
sockets bound, but playback never starts and remotes can no longer load anything.
OCCURRENCE 1 — 2026-07-30 18:32:15 (mid-playback)
Last lines:
18:32:14 Trace: [] [HighQuality 35.6x, 16/44 MQA TIDAL FLAC => 16/44]
[100% buf] [PLAYING @ 1:46/3:03]
18:32:15 Info: [stats] 20888mb Virtual; 2691mb Physical = 1411mb GC-committed
(1047mb Managed-live = 74% of committed) + 1280mb Native;
399 Handles, 88 Threads
Nothing after that. [stats] normally appears every ~10 minutes (3124 entries in
that file alone), so the process went silent for over an hour.
In this occurrence the image server on port 9330 stopped accepting TCP
connections entirely — connections were dropped, never refused.
OCCURRENCE 2 — 2026-07-31 01:17:31 (while LOADING a track)
Last lines:
01:16:46 Trace: [] [HighQuality, 16/44 TIDAL FLAC => 16/44] [STOPPED @ 0:00]
01:17:14 Trace: [] [HighQuality, 16/44 TIDAL FLAC => 16/44] [LOADING @ 0:00]
01:17:14 Debug: [easyhttp] GET https://api.tidal.com/v1/tracks//playbackinfo
postpaywall?...audioquality=HI_RES_LOSSLESS... returned 200
01:17:14 Trace: [tidal/http] ... => Success
01:17:16 Info: [stats] ... 698 Handles, 73 Threads
01:17:31 Info: [stats] ... 698 Handles, 90 Threads
Nothing after that.
Two things stand out here:
- Thread count rose from 73 to 90 in fifteen seconds, and two [stats] lines
landed 15 s apart instead of the usual 10 minutes — something was spinning up
threads right before the freeze.
- Unlike occurrence 1, the image server on 9330 kept working perfectly
afterwards: it served a real 166 KB cover in 42 ms an hour into the freeze,
while the Remoting ports and all playback were dead. So parts of the process
are alive while the core loops are stuck.
TRIAGE STEPS ALREADY COVERED
- Rebooting the Core fixes it, and it comes back: the restart at 19:35 bought
exactly 5h42 of uptime before the next freeze at 01:17.
- Rebooting the networking gear changes nothing: the router was restarted at
23:55 that same night and the Core still froze at 01:17.
- Background and On-Demand Audio Analysis set to Off. Worth noting that my
library is 100% TIDAL streaming with zero local files, so audio analysis has
nothing to process here in the first place.
- Restarting the remote app changes nothing, as expected.
- DNS: I cannot change the router's DNS servers (the gateway is a managed
firewall and I do not hold its admin credentials), but I measured DNS
instead of guessing: 30 out of 30 lookups succeeded against the gateway
resolver, 28 ms average, 32 ms worst. More to the point, at the exact moment
of freeze 2 the Core resolved and reached api.tidal.com in 24 ms and got a
200. DNS was healthy while the Core was hanging.
- I have NOT reinstalled the remote app, and I want to be transparent about
why rather than claim a step I did not take: the fault is captured
server-side. RoonServer's own log stops mid-line on the Core while the
process stays up. Occurrence 2 began while the Core was loading a track. No
change to a controller on another machine can act on that, so a reinstall
would not test anything. I will of course do it if you still want it ruled
out formally.
WHAT IT IS NOT
- Not TIDAL: every TIDAL API call at the moment of the freeze returned 200 in
24-29 ms, including the playbackinfo request.
- Not the network: 0% loss, 3-9 ms to the Core, and the appliance's own web
interface answered in 11 ms during both freezes.
- Not resource exhaustion: 399 and 698 handles respectively, memory flat for
hours beforehand. No "Too many open files", nothing in the log at all.
- Not the hardware: the appliance itself stayed fully responsive throughout.
FREQUENCY
20 Jul 22:00 → 22 Jul 12:00 outage
22 Jul 17:00 → 29 Jul 12:00 seven clean days, ~1900 successful image requests,
zero failures
29 Jul 13:00 → 29 Jul 16:00 outage
30 Jul 18:32 freeze (occurrence 1)
31 Jul 01:17 freeze (occurrence 2), ~5h40 after a restart
RECOVERY
Only a full restart of the appliance. Restarting the Roon remote does nothing,
as expected.
PRIOR REPORTS THAT LOOK RELATED
I searched your community before writing, and three existing threads share parts
of this signature:
- "Playback stops and continues sometimes later, mostly on MQA TIDAL tracks"
community.roonlabs.com/t/.../85727
- "A memory leak in RoonAppliance" / "Since build 952 a real big memory leak
(Linux)" — threads climbing, server becoming unresponsive with no error
community.roonlabs.com/t/.../236489 and /202771
- "Roon Server crashes and restarts with no indication of trouble in the log
files" — nothing at app level, fault only visible at system level
community.roonlabs.com/t/.../174763
I mention them in case they help you correlate; my case differs in that the
process does not crash or restart — it stays up and silent indefinitely.
QUESTIONS
1. Does this signature match a known deadlock in build 1671 on linuxx64?
2. Both freezes occurred during TIDAL track transitions, and occurrence 2 was
requesting HI_RES_LOSSLESS. Given the MQA-related playback threads above, is
switching TIDAL streaming quality away from MQA to hi-res FLAC a sensible
thing for me to try as a diagnostic? If so I will run it and report back.
3. I have the complete log archives from immediately after each freeze. Where
should I upload them?
Happy to run any diagnostic you need — the fault reproduces roughly twice a day.
Thank you,
Describe your network setup
ISP: XEFI (Lyon, France), fibre.
Gateway / firewall: a Sophos UTM 9 appliance. It is managed by a third-party IT
integrator and I do not hold its admin credentials, so I cannot inspect or change
its configuration myself. It also acts as the LAN's DHCP server (24-hour leases)
and DNS resolver. Worth flagging: this model reached end of life on 30 June 2026.
LAN: a single flat /24 subnet, no VLANs.
Wi-Fi: a TP-Link access point. My Roon remote (macOS) connects over Wi-Fi at
5 GHz on a 160 MHz channel, -59 dBm, 816 Mbps negotiated link rate.
Roon Server host: Innuos Zenith Mk.3 in Roon Core mode.
[TO CONFIRM: the Innuos is connected by Ethernet / Wi-Fi — please correct]
Audio endpoints:
- Meridian Explorer² USB DAC attached to the Innuos
- LUMIN U1 MINI as a network endpoint
- occasional AirPlay devices
Measurements taken around both freezes, so you do not have to take "the network
is fine" on faith:
- 0% packet loss over 44 consecutive probes to the gateway, to the Core, and
to the public internet
- ~75 Mbps download throughput
- DNS: 30 of 30 lookups succeeded, 28 ms average, 32 ms worst
- at the exact moment of the second freeze, the Core reached api.tidal.com in
24 ms and received a 200
Note on jitter: round-trip times from the Mac to every LAN device (gateway, Core,
LUMIN) show the same profile, ~4-5 ms minimum with occasional 85-100 ms spikes.
Since it is identical to all three targets, that variance comes from my Mac's
own Wi-Fi link, not from the Core.
One relevant network event, for completeness: the router went down entirely one
night and was restarted at 23:55. The Core still froze at 01:17 afterwards, so
the freeze is not downstream of that outage.