This has been reported/discussed before by others, but let me try once more.
When idle, Roon Server creates a CPU spike at exactly 30 second intervals – see below.
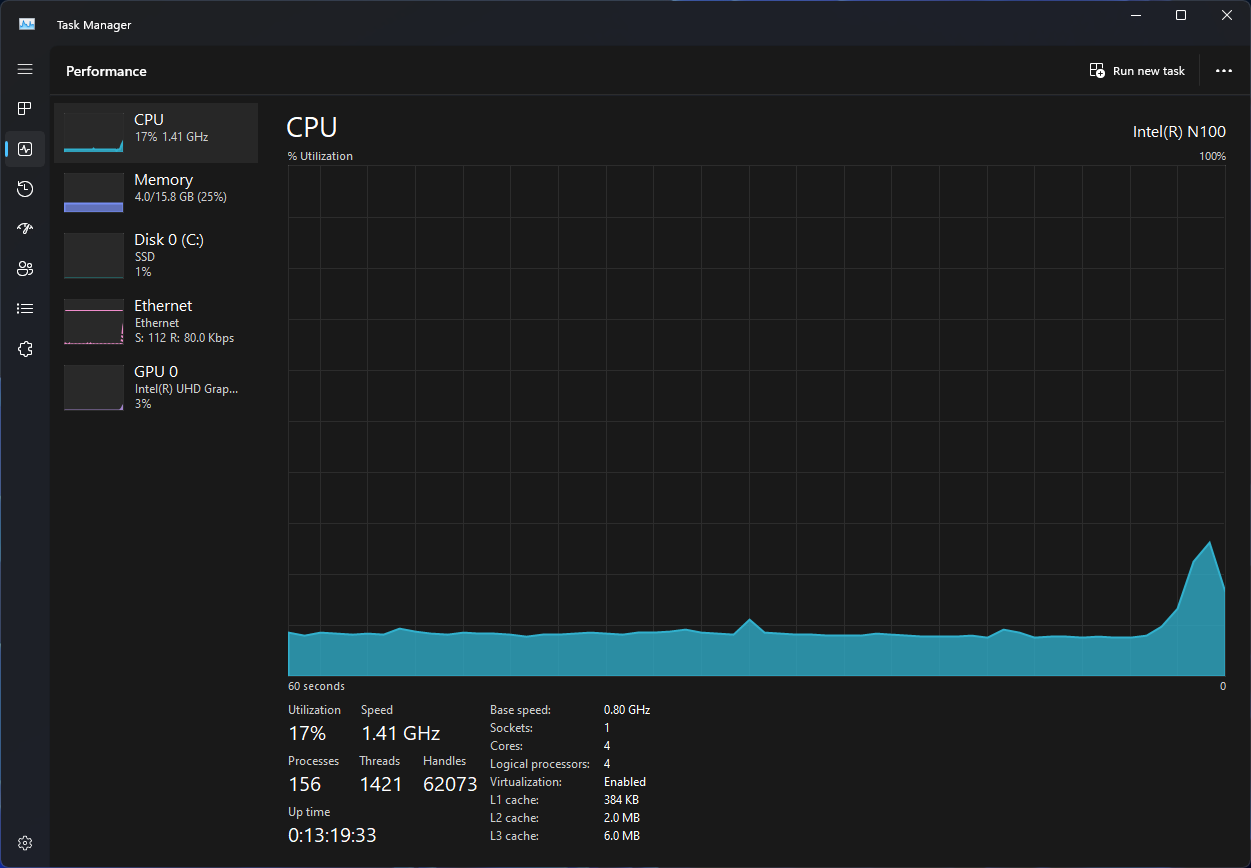
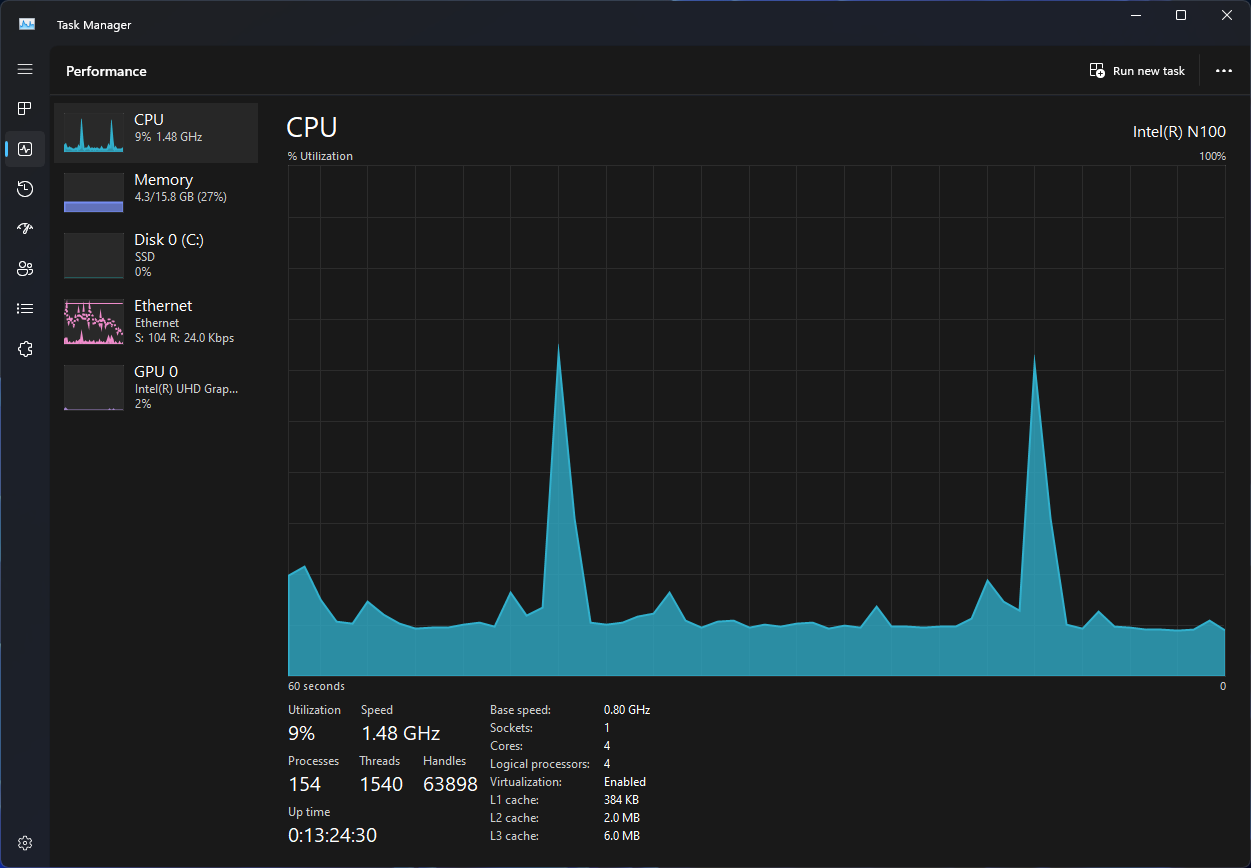
This is Windows 11 with up-to-date drivers, No NAS, SSD, Ethernet connected (No wifi), I did not see anything interesting in the logs either.
type or paste code 04/24 13:32:07 Info: [stats] 2102232mb Virtual, 217mb Physical, 42mb Managed, 1397 Handles, 77 Threads
04/24 13:32:08 Debug: [easyhttp] [37] POST to https://api.roonlabs.net/device-map/1/register returned after 128 ms, status code: 200, request body size: 4 KB
04/24 13:32:08 Trace: [devicemap] device map updated
04/24 13:32:22 Info: [stats] 2102214mb Virtual, 217mb Physical, 43mb Managed, 1369 Handles, 65 Threads
04/24 13:32:37 Info: [stats] 2102223mb Virtual, 217mb Physical, 44mb Managed, 1399 Handles, 71 Threads
04/24 13:32:52 Info: [stats] 2102215mb Virtual, 217mb Physical, 43mb Managed, 1393 Handles, 66 Threads
04/24 13:33:07 Info: [stats] 2102215mb Virtual, 215mb Physical, 43mb Managed, 1393 Handles, 66 Threads
04/24 13:33:22 Info: [stats] 2102217mb Virtual, 215mb Physical, 41mb Managed, 1373 Handles, 67 Threads
04/24 13:33:37 Info: [stats] 2102214mb Virtual, 215mb Physical, 43mb Managed, 1365 Handles, 65 Threads
04/24 13:33:38 Debug: [easyhttp] [39] POST to https://api.roonlabs.net/device-map/1/register returned after 132 ms, status code: 200, request body size: 4 KB
04/24 13:33:38 Trace: [devicemap] device map updated
04/24 13:33:52 Info: [stats] 2102214mb Virtual, 215mb Physical, 42mb Managed, 1365 Handles, 65 Threads
04/24 13:34:08 Info: [stats] 2102212mb Virtual, 215mb Physical, 42mb Managed, 1360 Handles, 64 Threads
04/24 13:34:23 Info: [stats] 2102212mb Virtual, 215mb Physical, 43mb Managed, 1361 Handles, 64 Threads
04/24 13:34:38 Info: [stats] 2102214mb Virtual, 215mb Physical, 42mb Managed, 1368 Handles, 65 Threads
04/24 13:34:53 Info: [stats] 2102209mb Virtual, 215mb Physical, 43mb Managed, 1356 Handles, 62 Threads
04/24 13:35:08 Info: [stats] 2102211mb Virtual, 215mb Physical, 43mb Managed, 1363 Handles, 63 Threads
04/24 13:35:23 Info: [stats] 2102212mb Virtual, 215mb Physical, 43mb Managed, 1368 Handles, 64 Threads
04/24 13:35:38 Info: [stats] 2102217mb Virtual, 215mb Physical, 44mb Managed, 1382 Handles, 67 Threads
04/24 13:35:53 Info: [stats] 2102209mb Virtual, 215mb Physical, 44mb Managed, 1373 Handles, 62 Threads
04/24 13:36:08 Info: [stats] 2102209mb Virtual, 215mb Physical, 44mb Managed, 1376 Handles, 62 Threads
04/24 13:36:23 Info: [stats] 2102209mb Virtual, 215mb Physical, 43mb Managed, 1377 Handles, 62 Threads
04/24 13:36:24 Trace: [broker/accounts] [heartbeat] now=4/24/2024 8:36:24 PM nextauthrefresh=4/24/2024 9:31:25 PM nextmachineallocate=4/25/2024 12:31:24 AM
04/24 13:36:38 Info: [stats] 2102218mb Virtual, 215mb Physical, 42mb Managed, 1375 Handles, 68 Threads
04/24 13:36:53 Info: [stats] 2102214mb Virtual, 215mb Physical, 42mb Managed, 1370 Handles, 65 Threads
04/24 13:37:08 Info: [stats] 2102217mb Virtual, 215mb Physical, 42mb Managed, 1385 Handles, 67 Threads
04/24 13:37:23 Info: [stats] 2102211mb Virtual, 215mb Physical, 41mb Managed, 1372 Handles, 63 Threads
04/24 13:37:38 Info: [stats] 2102217mb Virtual, 215mb Physical, 42mb Managed, 1396 Handles, 67 Threads
04/24 13:37:53 Info: [stats] 2102211mb Virtual, 215mb Physical, 42mb Managed, 1396 Handles, 63 Threads
04/24 13:38:08 Info: [stats] 2102209mb Virtual, 215mb Physical, 41mb Managed, 1370 Handles, 62 Threads
04/24 13:38:23 Info: [stats] 2102206mb Virtual, 215mb Physical, 42mb Managed, 1363 Handles, 60 Threads
04/24 13:38:38 Info: [stats] 2102214mb Virtual, 215mb Physical, 41mb Managed, 1393 Handles, 65 Threads
04/24 13:38:53 Info: [stats] 2102206mb Virtual, 215mb Physical, 43mb Managed, 1379 Handles, 60 Threads
04/24 13:39:08 Info: [stats] 2102208mb Virtual, 215mb Physical, 43mb Managed, 1388 Handles, 61 Threads
04/24 13:39:23 Info: [stats] 2102208mb Virtual, 215mb Physical, 41mb Managed, 1374 Handles, 61 Threads
here
Let me know if you need anything else to diagnose.