Perhaps this topic repeats some others, but still. Visualizers-sound analyzers provide a completely different listening experience, and sometimes provide quite important information. Now of those we have only the visualization of the dynamic range (timeline), which is not bad, but not enough, as for me. Why not provide such features (even if they are not enabled by default), it seems to me that it is not so difficult to implement, and you can implement it in a very beautiful, minimalistic, and perhaps functionally better way than what currently exists. Thank you. Below are examples of visualizer analyzers.
UPD: Yes, I understand, maybe you are afraid that one self-satisfied audiophile, listening to his “master” 96-24 MQA from Tidal, one day will open the analyzer and see (oh shock) that for some reason this Hi-Res is cut off from above by 22 kHz, yes and the depth does not exceed -96 dB, which does not correspond to a depth of 24 bits, he will get angry, will complain to Tidal, and your dear partner Tidal will come to you and say “what is this?”. But… can disable this feature for streaming services? or display a warning “not recommended for the faint hearted audiophile to enable this feature”. OK, or it can at least get by with means that will not show this problem: a volumemeter, a step analyzer (essentially a visualizer) of the spectrum, an oscillograph.
While waiting for this to become a feature, have a look at my DIY solution to that kind of need - with it you can even usefully compare local content‘s dynamic range, as analyzed by ROON, with streaming versions.
It’s a RaspberryPi … with official 7" touchscreen and RPi-OS 32-bit bullseye desktop installation …
On top of that, I manually installed Roon bridge and set up and configured ALSA-loopback, in order to be able to group it with my main end point …
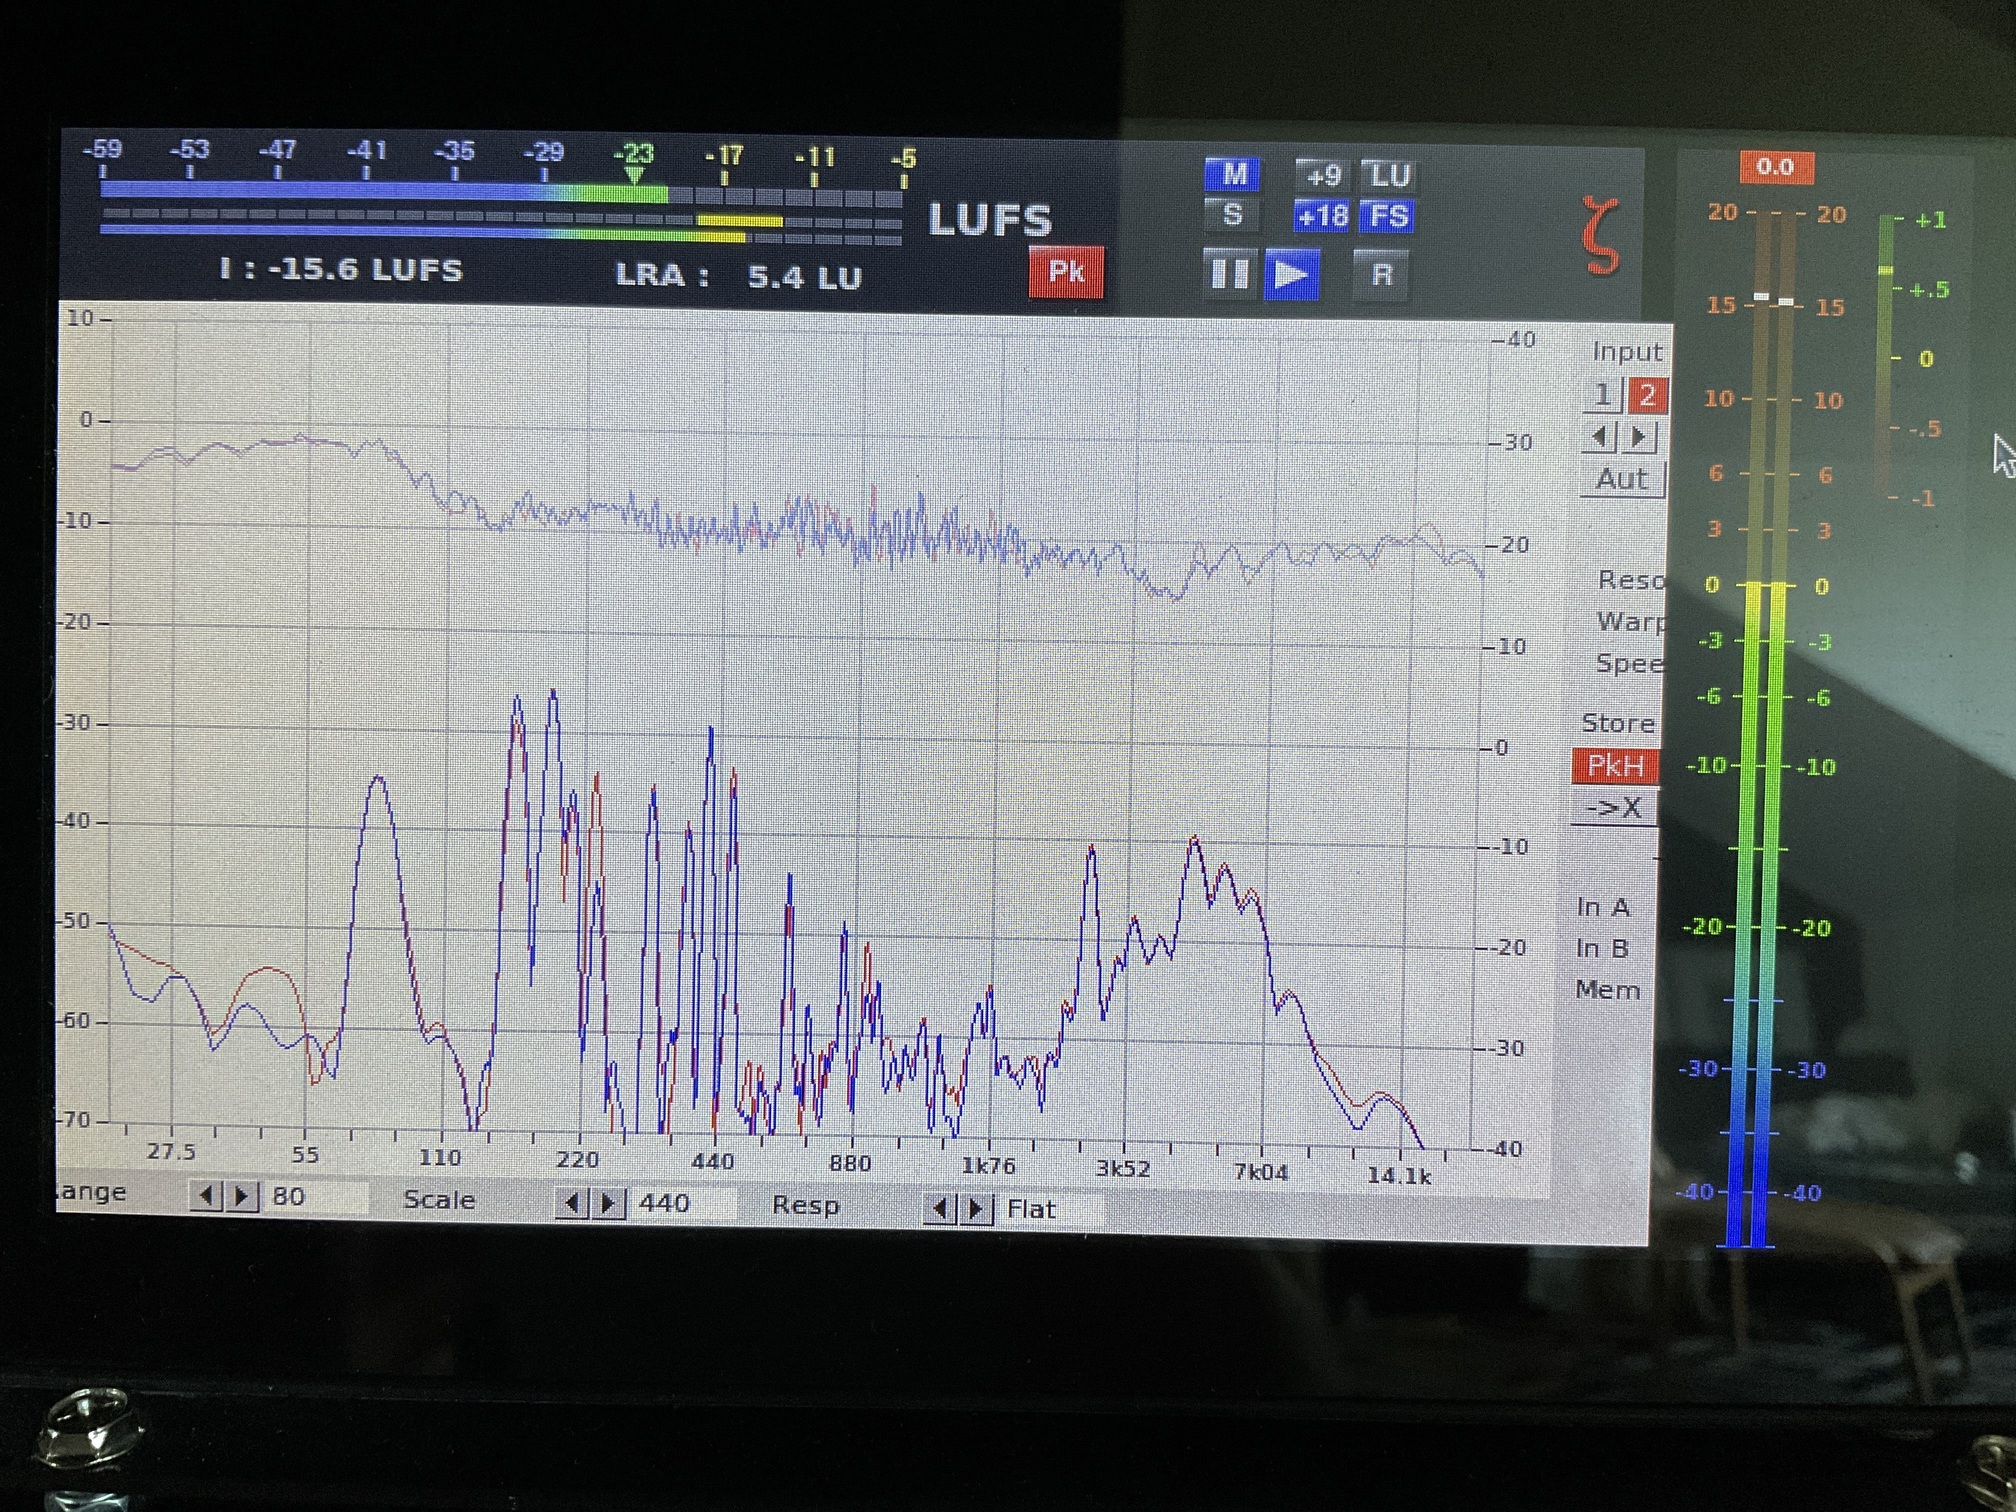
Then, using the OS software repository, I installed Jack audio control, EBU meter, Bob Katz‘s level and stereo correlation meter, and the spectrum meter.
Of course, all that needs some configuration to make it work in the end.
It doesn‘t offer all the rich information of Music Scope, which you seem to show a screenshot of, but it‘s all I could accomplish on a budget with free software, to be able to visualize local and streaming content, while showing it‘s accumulated live dynamic range according to EBU 128.
That‘s how it looks like today including the accumulated peak spectrum graph while low dynamic range live radio content is playing…