I’ll answer my own question regarding the export options: need to use 32bit PCM for Roon. 
Float also works, I haven’t compared so not sure which is better. And for house curve, yes you want that enabled, default values are fine but you can tweak them later to your liking (you can use same measurement).
Google “hifi house curve” to read about what it is, but basically its to make the sound levels equal across all frequencies (out ears interpet higher frequencies as higher dB than lower frequencies). In other words, to get a neutral sound for us human, we can’t have truly flat response, need to compensate for our hearing.
Hi Magnus,
I added the house curve. =)
I’ve started to read the thread (I’m at post 78). I keep seeing two points mentioned:
- Do not allow +dB corrections
- You can’t correct bass issues
Hmm. Okay, I did the following: L + R spiral moving mic measurement with about 40 seconds of measurements per channel in a good portion of the middle and back of the room (where I listen from). EQ was applied for 20 - 200 Hz (yes, I wanted bass correction explicitly.) The result:
L:
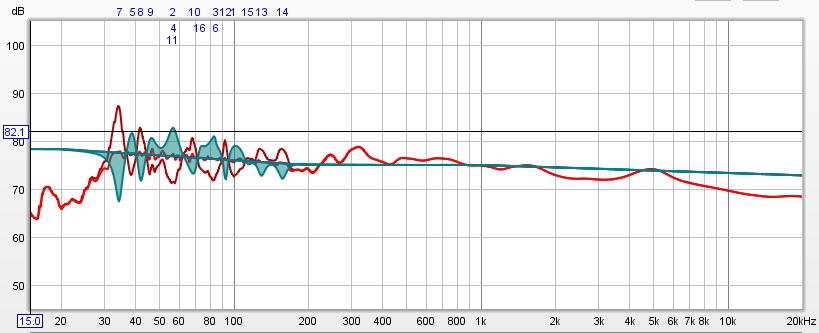
R:
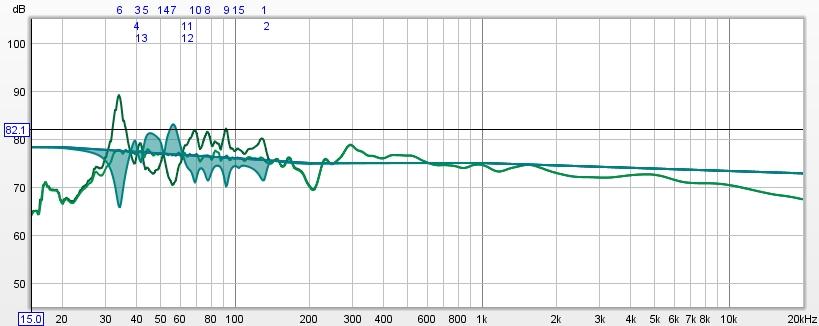
In Roon -3dB headroom was added, although I am not sure it’s really required, because overall the volume level has been reduced (I turn up the amp more to compensate… =)
And, so far in the few jazz saxophone tracks I’ve listened to, it sounds wonderful, from various listening locations in the room.
But, there are +dB corrections, and I’m correcting bass. Bad??
+dB corrections is fine unless its a very deep and steep dip, which usually indicates a null node that can’t be corrected. Your corrections looks fine, but I think you should do corrections to 500 to get even better results.
You could also try lowering the target with 5dB and do a full range correction. When experimenting, save the different corrections as different DSP Presets in Roon to make it easy to switch and compare.
Make sure you enable the clipping indicator in Headroom Management to see if clips occur.
I didn t read all the comments and replys but I think the filters are not suppsed to be matched flat to a pink noise because pink noise is 3db/oct. so basically you are placing the filters and the target speaker will have a boost 3 db/oct from the lows to highs :). Flat means no tilt.
Its Pink PN and it’s flat as far as I know (or maybe REW flattens it). It would sound pretty horrible if corrected to a +3dB/oct signal 
Pink Noize Pn is by default a 1/f or 3db/oct noise signal as it is closer to how the human ear hears and “equal energy” / frequency octave. White Noise is the flat one. The eq section of reweq will try to flatten the inequalities of the room, you have to give him a flat signal before the filters are calculated and applied. If you give a 3db/octave signal the filters will try to flatten that and will go quite opposite, you get an inverted + 3d/octave when applying the IR Convolution. The sine sweep and white noise have equal energy/frequency and you should use that for the calibration. It is mainly impossible to sound ok with what you have said unless you have another 3db/oct tilt filter somewhere to compensate and you didn’t notice. It does not sound horrible but you have more highs and less bass (3db tilt)
Here copied from REW manual:
“The Mode can be set to Spectrum for a spectrum analyser plot or to various RTA resolutions from 1 octave to 1/48 octave. The difference between spectrum and RTA modes is how the information is presented. In spectrum mode the frequency content of the signal is split up into bins that are all the same width in Hz. For example, with a 64k FFT length and 48 kHz sample rate the bins are 0.732 Hz wide. The plot shows the energy in each of those bins. In RTA mode the bin widths are an octave fraction, so their width in Hz varies with the frequency. For example, a 1 octave RTA plot has bins that are 70.7 Hz wide at 100 Hz (from 70.7 Hz to 141.4 Hz) and 707 Hz wide at 1 kHz (from 707 Hz to 1.414 kHz). The plot shows the combined energy at each frequency within each bin. This is closer to how our ears perceive sound. The different presentations mean signals with a spread of frequency content will look different on the plot. The best known examples are white noise and pink noise. White noise has the same energy at each frequency. On a spectrum plot, which shows the energy at each frequency, the white noise plots as a horizontal line. On an RTA plot it appears as a line that rises with increasing frequency, as each RTA bin gets wider it covers more frequencies and so has more energy. The bin widths double with each doubling of frequency so the energy also doubles, which adds 3 dB on the logarithmic plots we use to show level. White noise sounds quite ‘hissy’, we perceive it as having more energy at higher frequencies.
Pink noise has energy that falls 3 dB with each doubling of frequency. On a spectrum plot it is a line that falls at that 3 dB per octave rate, on an RTA plot it is a horizontal line as the energy in the signal is falling at the same rate as the bins are widening. We perceive pink noise as having a uniform distribution of energy with frequency.”
When using the RTA plot pink noise will appear flat on the spectrum plot white noise will be flat.
1 Like
When I use Mode:Spectrum I see a 3 db tilt downwards from low to highs on the axis measuring pink noise pn. Yes it depends of the Rta Modes. But I guess we are using the spectrum mode when doing the eq in Spectrum:Mode so if you equalize a 3 db tilt of a pink noise the equalizer will work around the room modes and resolve problems that where presentet with a 3 db tilt (which was not in the room) thus resulting in an opposite tilt.
Check screenshots in guide, you have to use octave based mode, in this case I suggested using “RTA 1/48 Octave” which will compensate for the tilt since its based on octave. In other words, you get more energy for higher frequencies since the octave grows, which in total results in no tilt.
1 Like
Totally missed that, thank you !!!
I decided to go for my own house curve today on top of HAFS room correction I felt my speakers had lost a little of their own voice if you know what I mean. Quite happy with it. Will listen for a few days then return to Thierrys base correction and see which I prefer again.
I asked Thierry about adding PQE in Roon “on top” of his convolution filters, and he said it was perfectly fine (something about Roon PEQ being minimum phase I think which didn’t mess up his phase corrections).
1 Like
This is exactly what I needed. Very clear and I’m pumped about getting the microphone delivered so I can dive in.
These past days was my first experience with DRC (and REW), and Magnus’s Guide was excellent. With the extra info on the few changes in the current REW GUI, it was easy to do. The moving mic / RTA / pink noise measurements are really a snap and take out the finikiness of measurements if you happen to have mutiple or a broader listening area. Very excellent!!
Is the guide at the top of this thread from April 2017 still the most up to date version? REW itself has gone through a number of changes since then, with some of the windows looking different to those shown in the guide.
Yes, some screenshots should be replaced, but other than that its valid as far as I know.
I guess I should update this guide sometime, if I could find the time and motivation.
Hi Magnus,
Would you like me to add those few GUI changes that I discussed with you just recently?
1 Like
Thanks for the offer, but I think I will wait for the next proper (non-beta) release of REW and than do an update. When doing that, I will also make some smaller changes to the guide (simplify it a little).
1 Like