It’s definitely memory leaks. I’ve seen the exact same behavior over multiple releases.
On one version my Roon Core sits comfortably around 1.5–2 GB of RAM usage. Then a new release comes out and suddenly it climbs to 5 GB with no changes on my side. Same hardware, same library, same DSP, same everything.
A few releases ago it was even worse. It kept creeping up to 11 GB over time. The only thing that fixed it was a later update, after which it dropped straight back to around 1.5–2 GB again. That clearly shows it wasn’t my configuration.
So when people say it’s “normal usage” or “Linux caching” or “your setup,” that just doesn’t line up with what I’m seeing. If nothing changes in the system except the Roon version, and RAM usage swings from 2 GB to 11 GB and back again depending on the release, that strongly points to a software issue.
Same configuration as always. Only the release changes. The memory footprint shouldn’t behave like that.
I’m not seeing evidence of a server memory leak at present. They did last year. i documented it, as did others. @mjw actually deployed the telemetry stack I use and saw the same thing.
Roon finally did get around to fixing it and I haven’t seen any evidence that it has recurred. I continue to monitor with the same telemetry stack.
It’s possible there are leaks in features I don’t use. If someone believes that’s the case, it would be helpful to provide some illustration that memory really is growing over time for them.
Clients are another story. I’ve never actually tracked clients so they may be leaking.
Spot on here… this was definitely doing my head in. My radio silence is confirmation they fixed whatever leak was affecting my use case (and others’). Roon has been solid since.
Data up until the last couple of releases showed no sign of a memory leak. I’ve just rebuilt my server and haven’t setup Glances/Grafana yet, so I won’t have data for a couple of weeks or so.
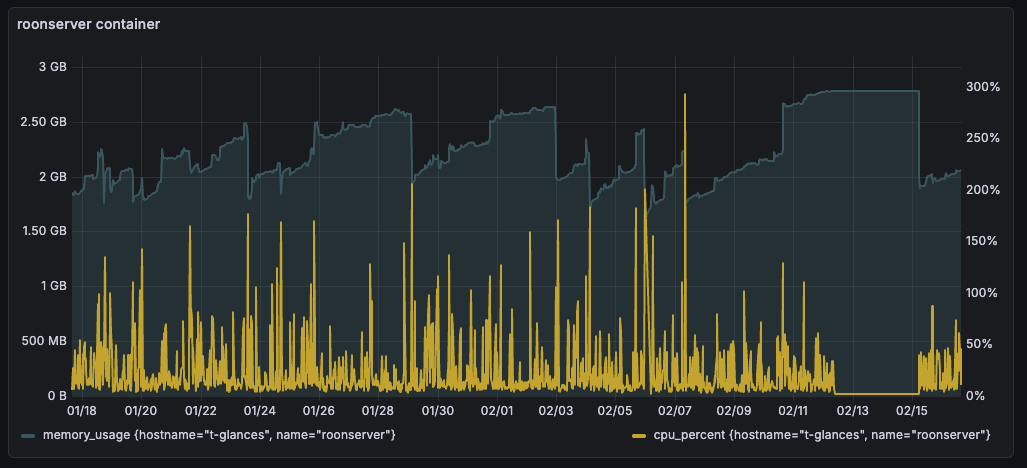
This is the last month. I had a data collection issue from 2/13-2/15 (unrelated to Roon) that caused memory and CPU to go flat, so you can ignore that small period. The rest of this is quite normal for a .net app using garbage collection.
I think this is a question for me, but I’m not sure. I’ll assume it is.
This is a measurement of my system only so the only thing we can be sure of is that it describes my local system. This is important because if there is some feature that has a memory leak that I’m not using, then the leak won’t show up for me. I don’t currently use MUSE, for example.
In the past, though, the large memory leaks we’ve seen have been fairly universal - they’ve impacting most or all people and haven’t been particularly hard to track down. My telemetry is a pretty good indicator that there isn’t a problem like that in the current release.
There is information in Roon’s logs about memory use. You might be able to find something there that helps you see if you’re actually experiencing a server-based memory leak.
As you have a Nucleus device, accessing the logs is quite easy. There’ll be upto 20 log files.
Once found, copy the contents (of as many as you want) and paste into an AI app of your choice.
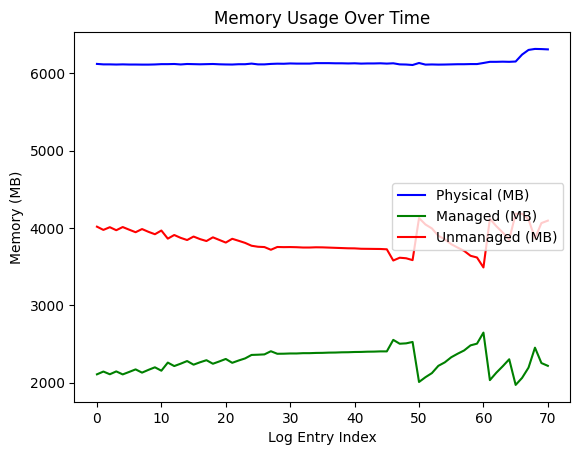
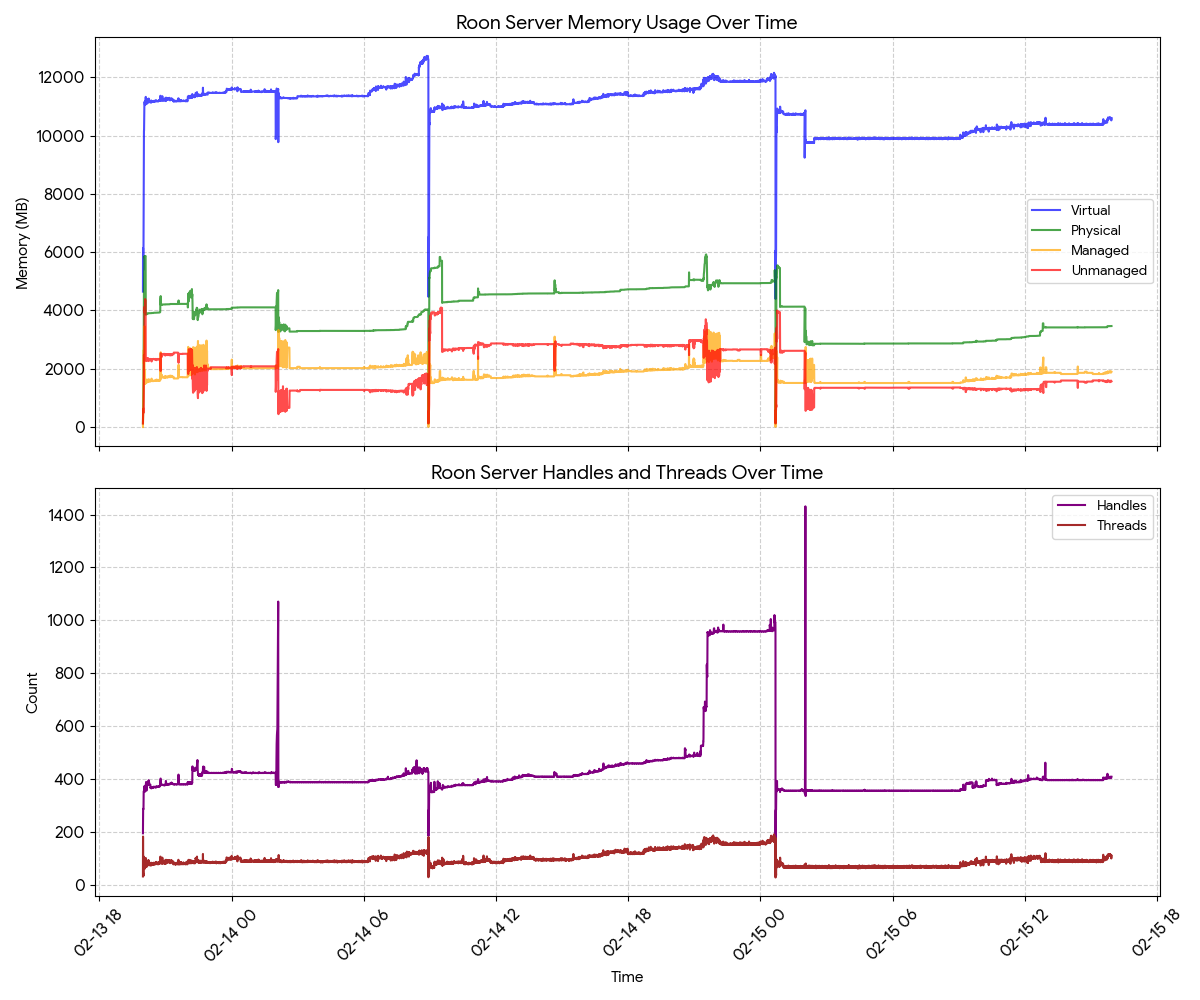
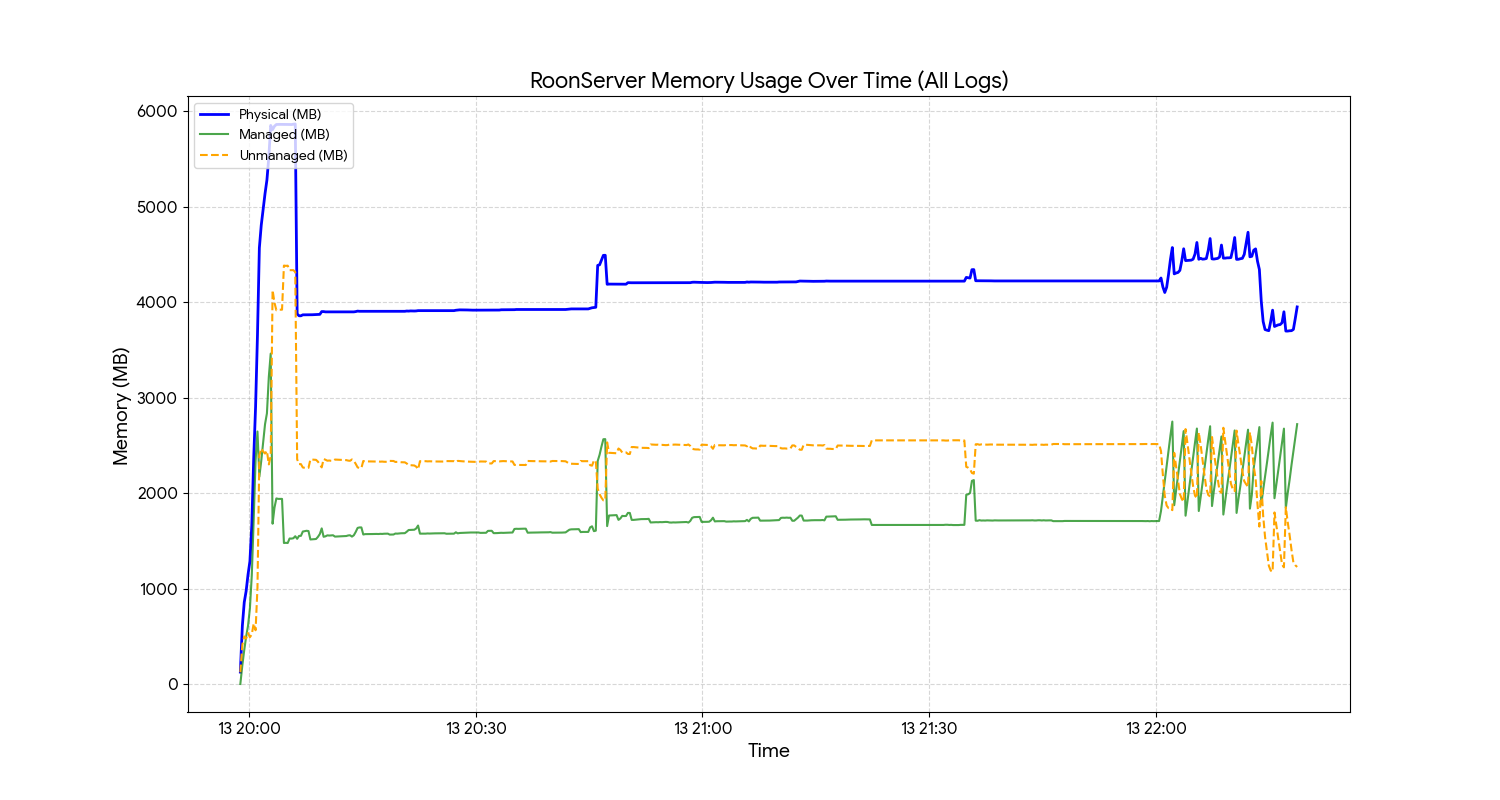
Ask it to extract all similar lines to this 02/17 07:19:29 [Local 02/17 07:19:29] Info: [stats] 11588mb Virtual, 6116mb Physical, 2197mb Managed, 3919mb estimated Unmanaged, 357 Handles, 73 Threads,
You can ask it to plot a graph or extract the data to do what you want with it.
The analysis you were able to do helps. I agree with @MusicD and @mjw that it doesn’t look like you have a memory leak.
That doesn’t mean that you aren’t seeing slow behavior, or even slow behavior over time. It just means that the specific cause is probably not a “memory leak”. A memory leak is a very specific type of software defect. There are plenty of non-memory leak reasons that something like Roon can be slow, or can get slow, over time.
You described this as your library:
So around 100,000 tracks.
From what I can see, Roon is using memory in the range of around 10GB - 12GB. It’s normal for an app written using .net (which is what Roon uses) to have its memory use grow for a while and then for it to drop, and repeat the process. Additional memory is used by the OS. But since you upgraded your memory to 32GB, it’s clear you’ve got plenty of memory. So that’s not the issue.
But I’m not sure about CPU. I don’t think Roon has ever said what processor is in the One but we know it’s something like a Celeron N105. I’ve never run Roon an anything close to that slow, and my library is smaller than yours, so I don’t know how that would perform but I think it would be slow.
Also keep in mind that the difference between local and Qobuz tracks doesn’t really matter for this kind of performance (for the most part). 100,000 tracks is 100,000 tracks. Local has the additional cost of audio analysis but that’s a one time thing.
I know @MusicD has tried to run on slower processors and @mjw knows lots about everything. One of them can comment.
I hope you don’t stop trying to figure this out even though we can rule out “memory leak”.
@bob_prangnell started this thread - maybe something in this conversation helped.
@gTunes Thx for the summary I appreciate it big time. Good to have sorted this out. I think I have mentioned it before but my system is very update sensitive. Some updates works fine and some are terrible. Let’s see what the future brings.