Roon has been running fine before Roon Service was lost due to Google network issues. It can take a few minutes before receiving search results, getting an album to play, skipping tracks on an album, etc.
My web connection is fine (60 MBs Downstream/ 11 MBs upstream). No problem surfing on the web or downloading files. Only the Roon service is extremly slow.
Was just listening to an album and was just skipping a track, it took about one minute to get the wanted track…My Internet provider speed test gave me 67.8 Mbps/11.8 Mbps…
Hello @Daniel_Babeux, I don’t believe this issue would be related to the google service outage. Could you please give everything a reboot (including router and other network devices) and see if you can still reproduce the issue? Thanks!
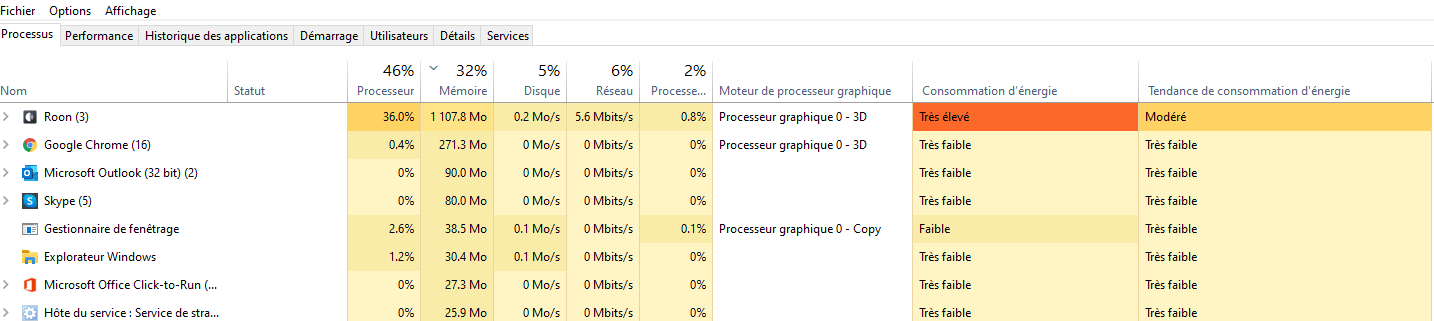
I have written about this issue 2 weeks ago, with partial resolution. When I try to play a downloaded album either from Tidal or local network album it can take up to a minute before Roon reacts. Same when I try to skip tracks on an album.Yesterday the issue appeared again and I was fortunate to have the Windows 10 Task Manager operating. Here is a screen shot indicating what was going on:
Once the Roon request was completed, memory usage dropped from 72% (66% when I did the screen shot) to 42% and energy consumption dropped from ‘Very high’ to ‘Very low’. Roon ran correctly afterwards.
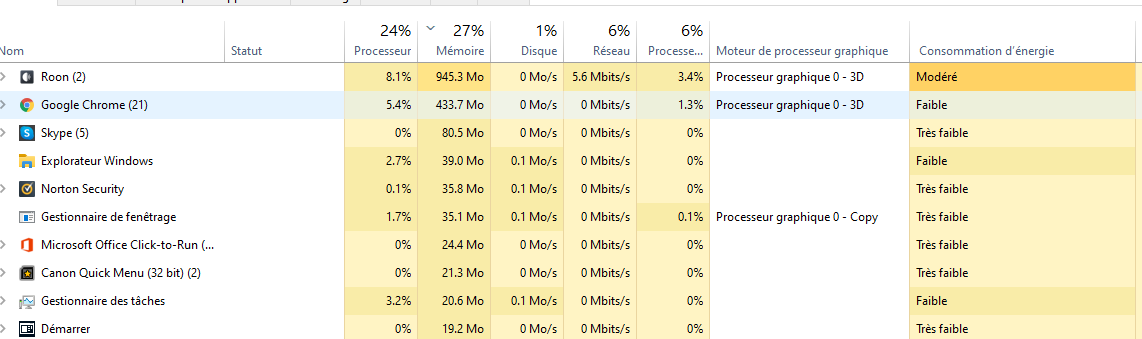
This morning around 8:32 (Canada Eastern time) I tried to view the ‘New Albums’ in the ‘Retro’ section. It took about a minute to show the new albums. During that period, the processor requirements in Windows ‘Task Manager’ rose to 52% with ‘energy consumption’ rising to ‘Very high’. Once the ‘New Albums’ request was accomodated, processing requirements dropped down to 5% with ‘Low’ energy consumption. Any suggestions?
This morning at 11:56 (Canada Eastern time) tried to download ‘Rival Sons- Feral Roots’ album. Took over a minute to download. Processor activity was at 53%, before I could do the capture screen.
I have enabled diagnostics on your account so our technical staff can get some more insight into what’s going on here. The next time your Core is active a diagnostics report will automatically be generated and uploaded directly to our servers.
Once that’s been received, I’ll be sure to update this thread and pass the diagnostics over to the team for further analysis.