Very regular 2-minute drop outs / need manual restart

Roon Core Machine

Asus mini MrChromebox-4.18.1

description: Asus Mini i7 16GiB RAM 128GiB SSD
serial: J4MSCX004067
 *-firmware
      description: BIOS version: MrChromebox-4.18.1
 *-cpu
      product: Intel(R) Core(TM) i7-5500U CPU @ 2.40GHz
 *-memory
      description: System Memory
      physical id: 9
      slot: System board or motherboard
      size: 16GiB
    *-bank:0
         description: SODIMM DDR3 Synchronous 1600 MHz (0.6 ns)
         product: ASU16D3LS1K1DGR/8G
         vendor: Kingston
    *-bank:1
         description: SODIMM DDR3 Synchronous 1600 MHz (0.6 ns)
         product: ASU16D3LS1K1DGR/8G
         vendor: Kingston
 *-scsi
      physical id: d
      logical name: scsi0
      capabilities: emulated
    *-disk
         description: ATA Disk
         product: M.2 SSD 128GB
         logical name: /dev/sda
         size: 119GiB (128GB)
         capabilities: gpt-1.00 partitioned partitioned:gpt
         configuration: ansiversion=5 guid=e255dfee-7232-4d05-b563-38165a4fe09d logicalsectorsize=512 sectorsize=512
       *-volume:0
            description: Windows FAT volume
            vendor: mkfs.fat
            size: 1073MiB
            capabilities: boot fat initialized
       *-volume:1
            description: EXT4 volume
            vendor: Linux
            size: 2GiB
            capabilities: journaled extended_attributes large_files huge_files dir_nlink recover 64bit extents ext4 ext2 initialized
            configuration: created=2023-01-14 01:23:37 filesystem=ext4 lastmountpoint=/boot modified=2023-02-22 23:28:36 mount.fstype=ext4 mount.options=rw,relatime mounted=2023-02-22 23:28:36 state=mounted
       *-volume:2
            description: EFI partition
            logical name: /dev/sda3
            size: 116GiB
            capabilities: lvm2

Networking Gear & Setup Details

Wired, no VPN, Asus RT-AX92U router. 1GiB fiberglass internet:

   Speedtest by Ookla

      Server: WorldStream B.V. - Naaldwijk (id: 6554)
         ISP: CAIW Internet
Idle Latency:     4.25 ms   (jitter: 0.07ms, low: 4.17ms, high: 4.29ms)
    Download:   938.57 Mbps (data used: 446.1 MB)                                                   
                  9.37 ms   (jitter: 0.57ms, low: 4.48ms, high: 10.58ms)
      Upload:   927.44 Mbps (data used: 441.3 MB)                                                   
                  4.49 ms   (jitter: 0.22ms, low: 4.07ms, high: 5.14ms)
 Packet Loss:     0.0%
  Result URL: https://www.speedtest.net/result/c/51e6a662-6110-48b6-acaf-ad7ee31b0401

Adapters on board of Roon core:

   *-network
        description: Ethernet interface
        product: RTL8111/8168/8411 PCI Express Gigabit Ethernet Controller
        vendor: Realtek Semiconductor Co., Ltd.
        physical id: 0
        logical name: enp1s0
   *-network
        description: Wireless interface
        product: Wireless 7260
        vendor: Intel Corporation
        physical id: 0
        logical name: wlp2s0

Connected Audio Devices

 *-pci
    *-usb
       *-usbhost:0
            product: xHCI Host Controller
            vendor: Linux 5.4.0-139-generic xhci-hcd
            configuration: driver=hub slots=11 speed=480Mbit/s
          *-usb:1
               description: Generic USB device
               product: EDIROL UA-25
               vendor: Roland
               physical id: 5
               bus info: usb@1:5
               version: 1.07
               capabilities: usb-1.10
               configuration: driver=snd-usb-audio maxpower=480mA speed=12Mbit/s
          *-usb:2
               description: Audio device
               product: DX3 Pro+
               vendor: Topping
               physical id: 6
               bus info: usb@1:6
               version: 1.25
               capabilities: usb-2.00 audio-control
               configuration: driver=snd-usb-audio speed=480Mbit/s

Number of Tracks in Library

12k tracks

Description of Issue

I’ve experienced slow track switching often. I already spotted that if starting
a new track takes long (>30s) there will be a period of high CPU usage on the
Roon core at that time.

Today, after some time of reduced listening, the experience was much worse than
usual, to the point where things were unusable. Over a period of many hours I
got a consistent pattern of 2-minute drop-out every ~10 minutes. During such a
drop out the music stops, no audio devices show in the app and the app is
barely functional. The core is still available though (which the UI reflects).

Any attempt at remediation on the UI side (restarting remotes or using a
different device) had no effect.

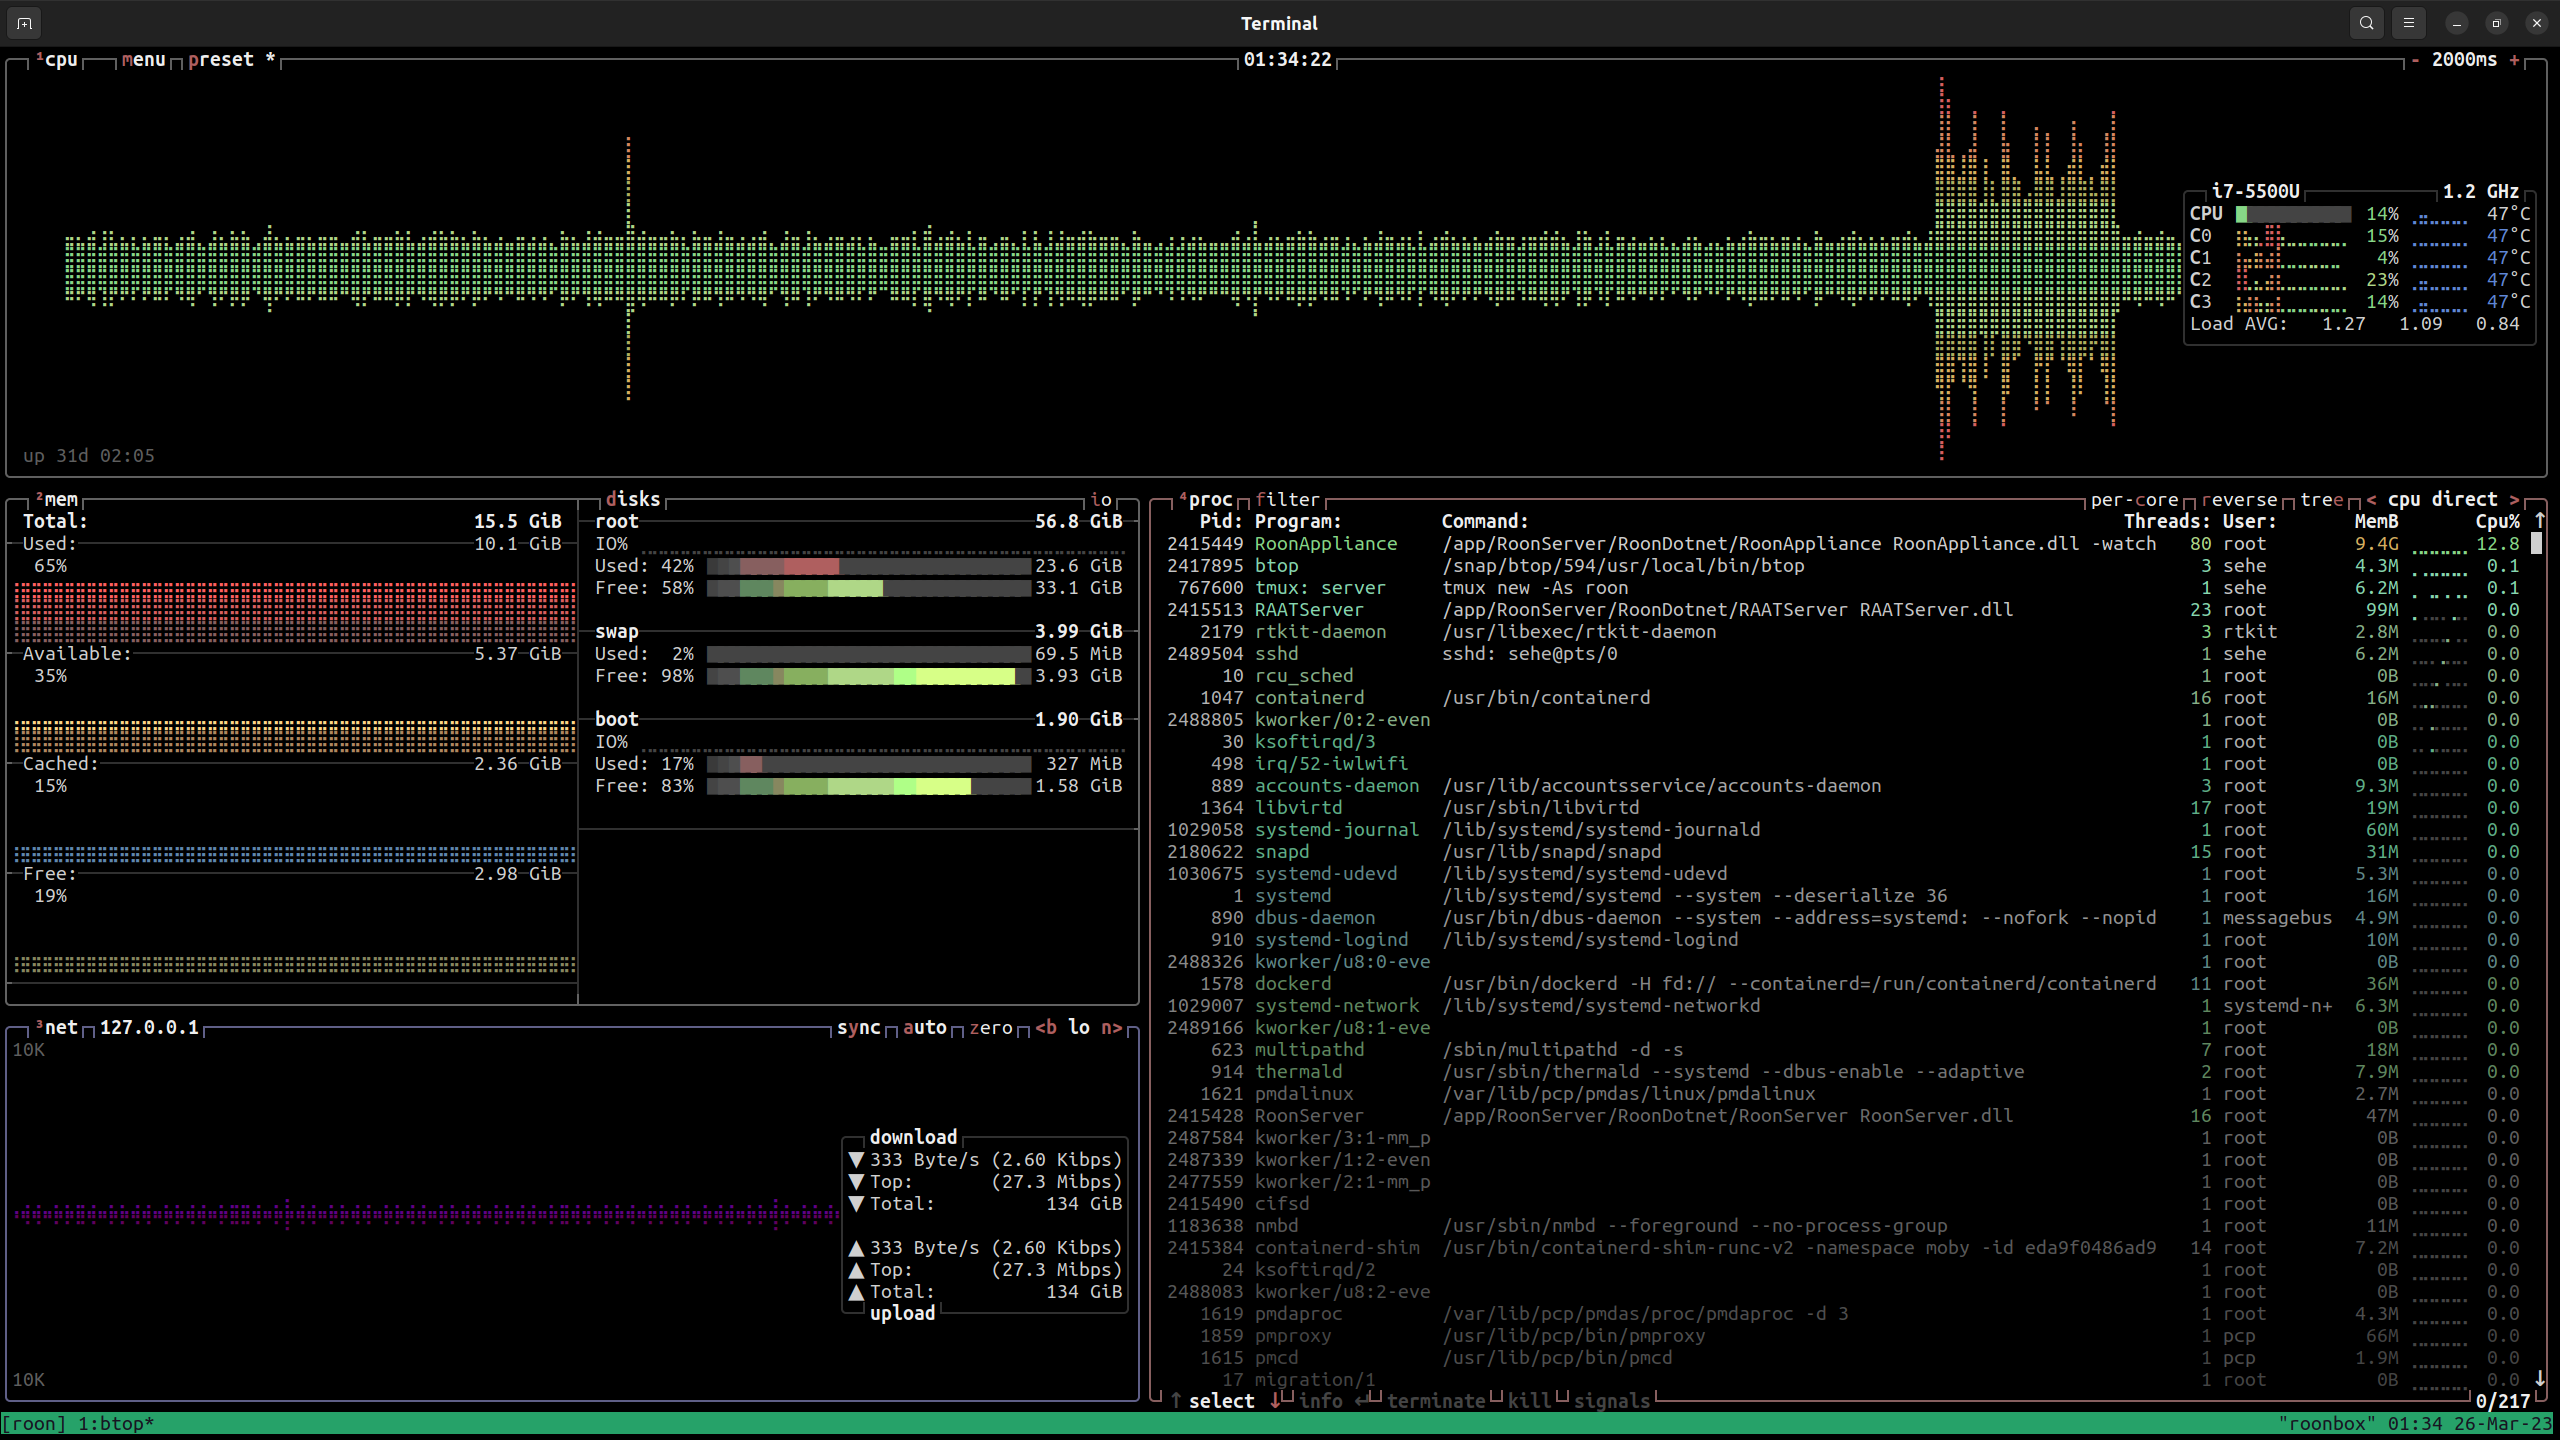
I shifted my observations to my Roon Server install. Below are several screen
casts of adjacent problem episodes. I show the Roon Remote UI alongside system
monitoring (later episodes showing more relevant detail).

All music were Qobuz tracks from outside the library. Audio format&resolution,
streaming paths and so on are recorded as part of the UI.

first episode

screencast

  • 01:48:41 - start heavy CPU on Roon server
  • 01:48:52 - music drop out / “crash” in the apps
  • 01:50:41 - recovery, apps respond again

second episode

screencast, the first 2-minute drop-out is still in view in the graph histories

  • 02:03:41 - start heavy CPU on Roon server
  • 02:03:52 - music drop out / “crash” in the apps

    note at 02:05:10 I started to include memory, disk and process list stats

  • 02:05:41 - recovery, apps respond again

third episode

screencast, along the way we can see a change of album format and corresponding
bandwidth usage

  • 02:18:41 - start heavy CPU on Roon server
  • 02:18:53 - music drop out / “crash” in the apps

    along the way I decided to drop disk cache (block/dentry caches, which is
    seen to free up 1.8GiB of “Cached” memory)

  • 02:20:44 - recovery, apps respond again

fourth episode

screencast, I finally get the sense to show the actual LAN nic instead of the
loopback network (localhost), also seen the Wlan which is clearly not used

  • 02:33:41 - start heavy CPU on Roon server
  • 02:33:52 - music drop out / “crash” in the apps
  • 02:35:43 - recovery, apps respond again

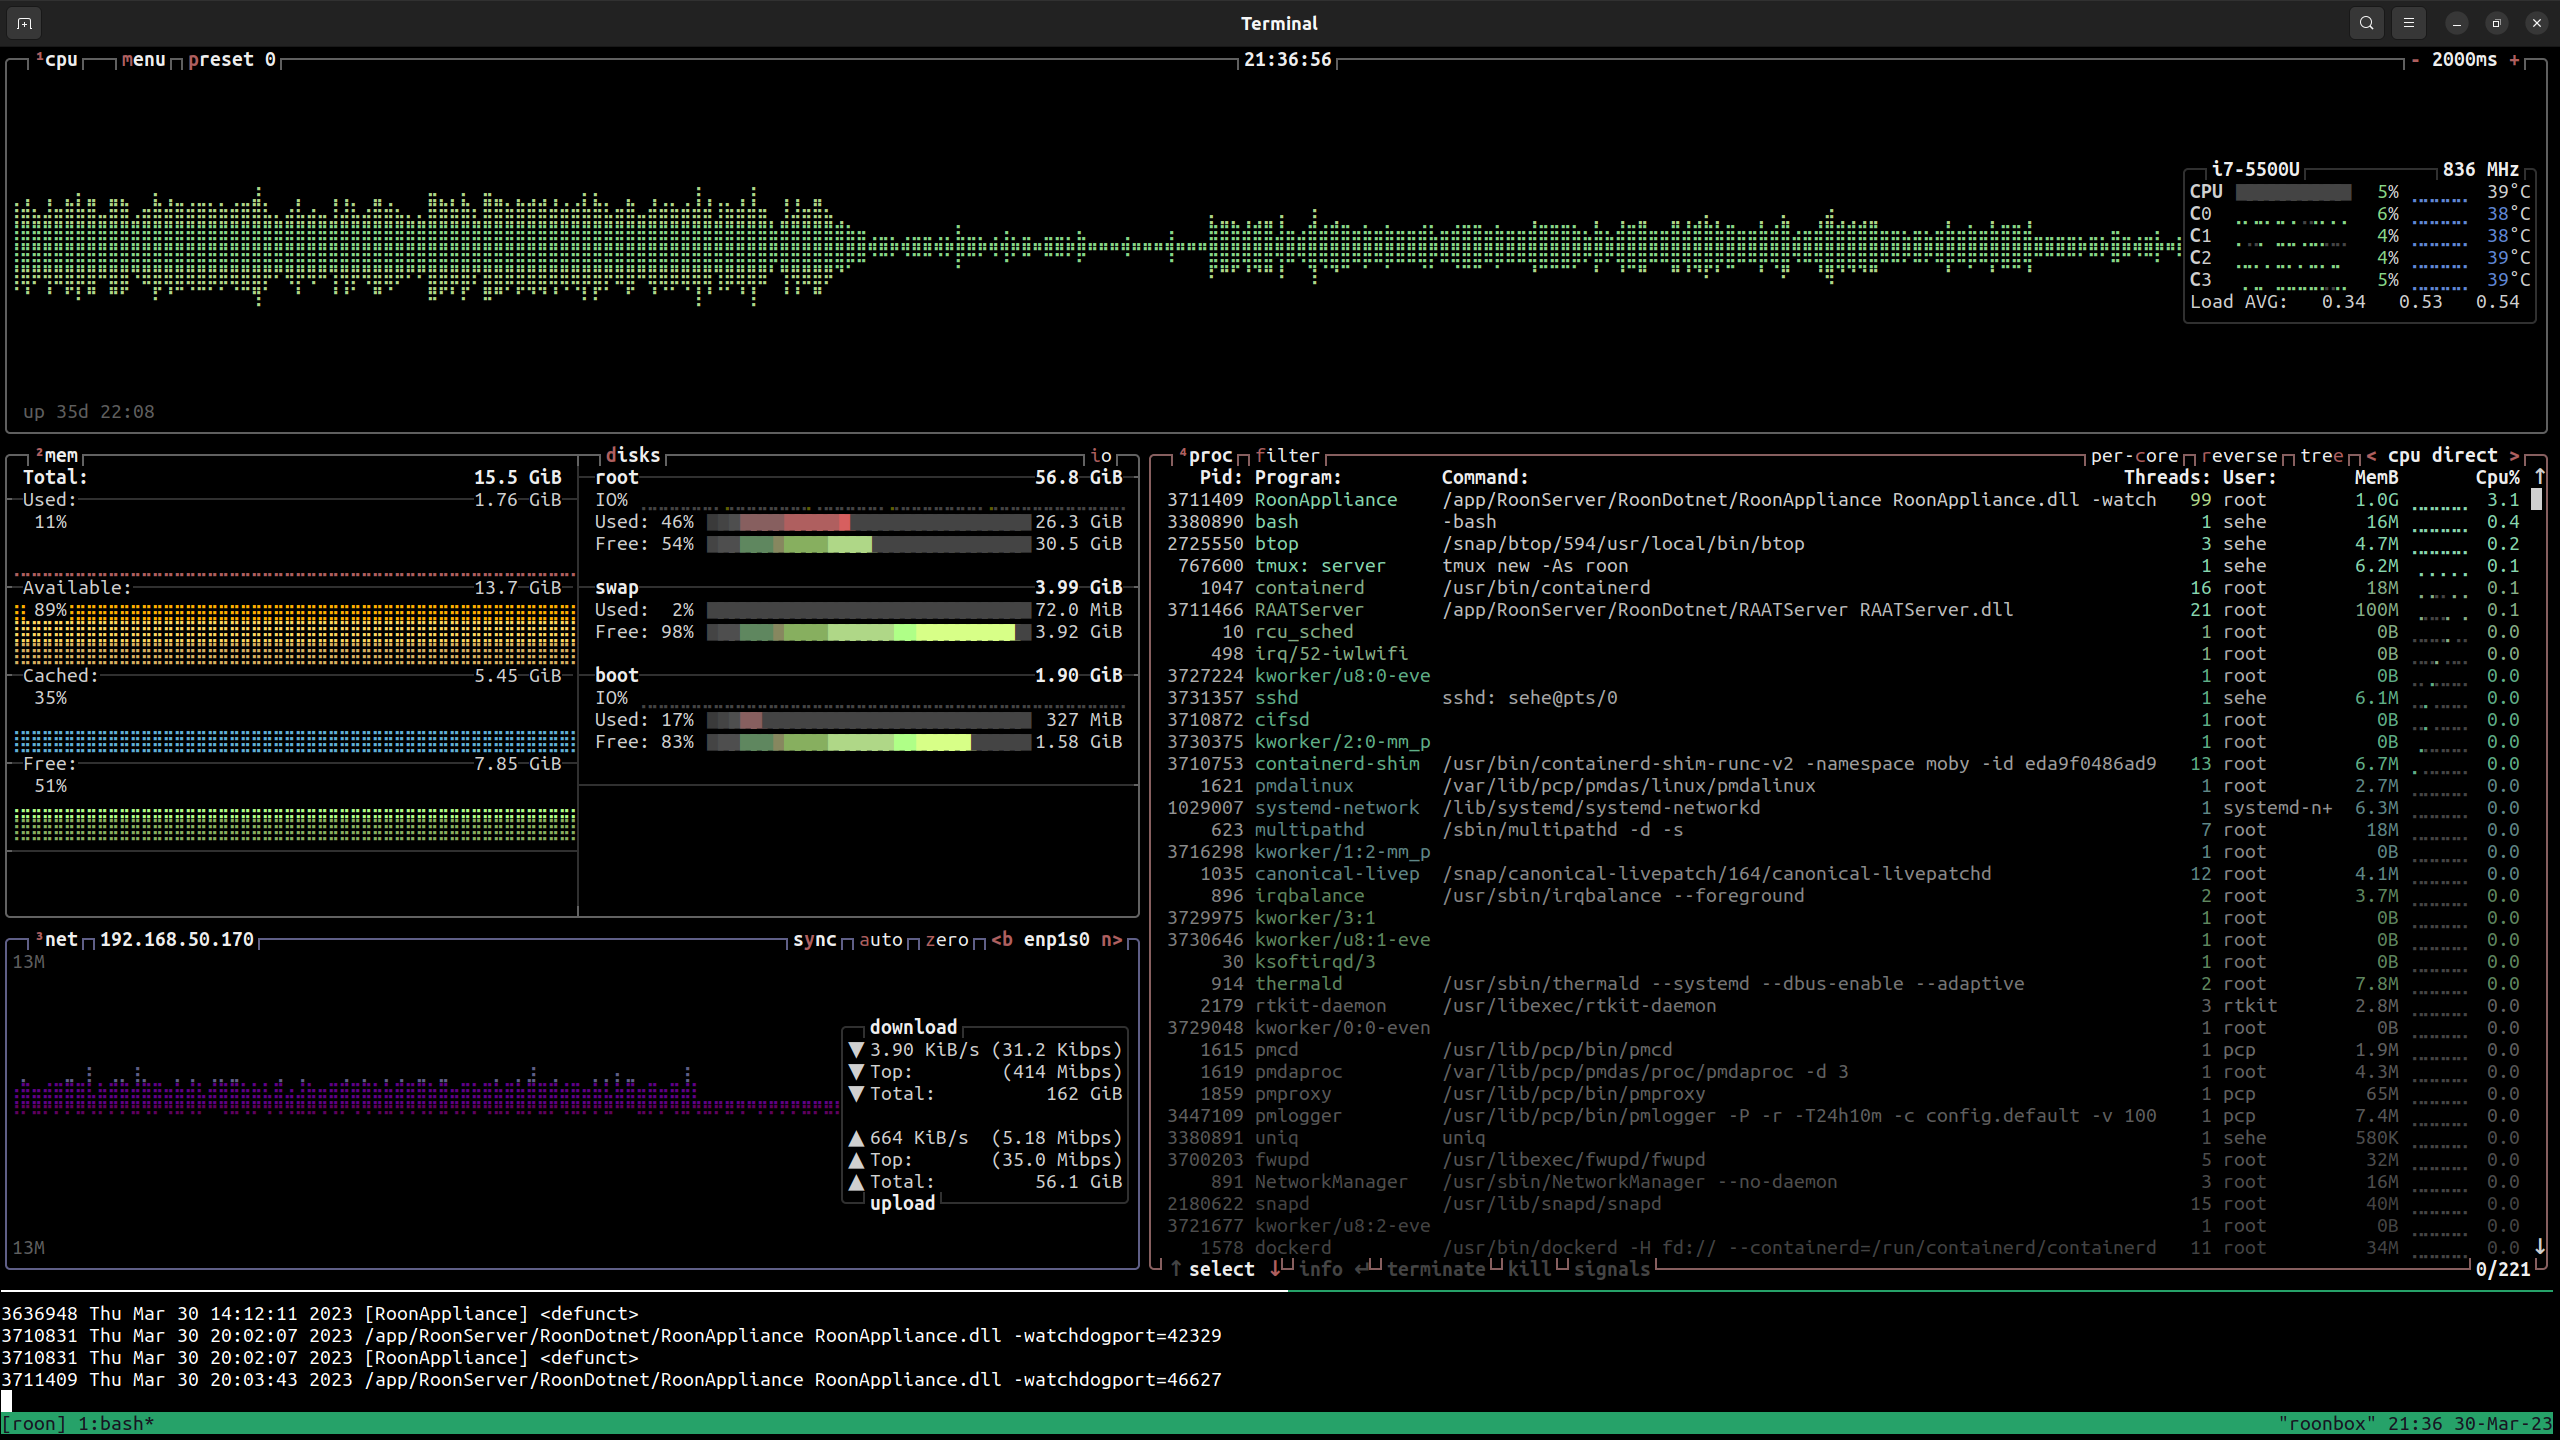
Bonus: restarting the Roon service. Also shows home screen (for library stats?)

screencast, note that after the restart the memory usage is negligable compared to
before, but the apps already work as expected

After the restart, none of the issues occurred for the time it took to write this report, which is roughly an hour. At the time I conclude this remark, the memory usage is still way down compared to the state in which the problem was manifesting.
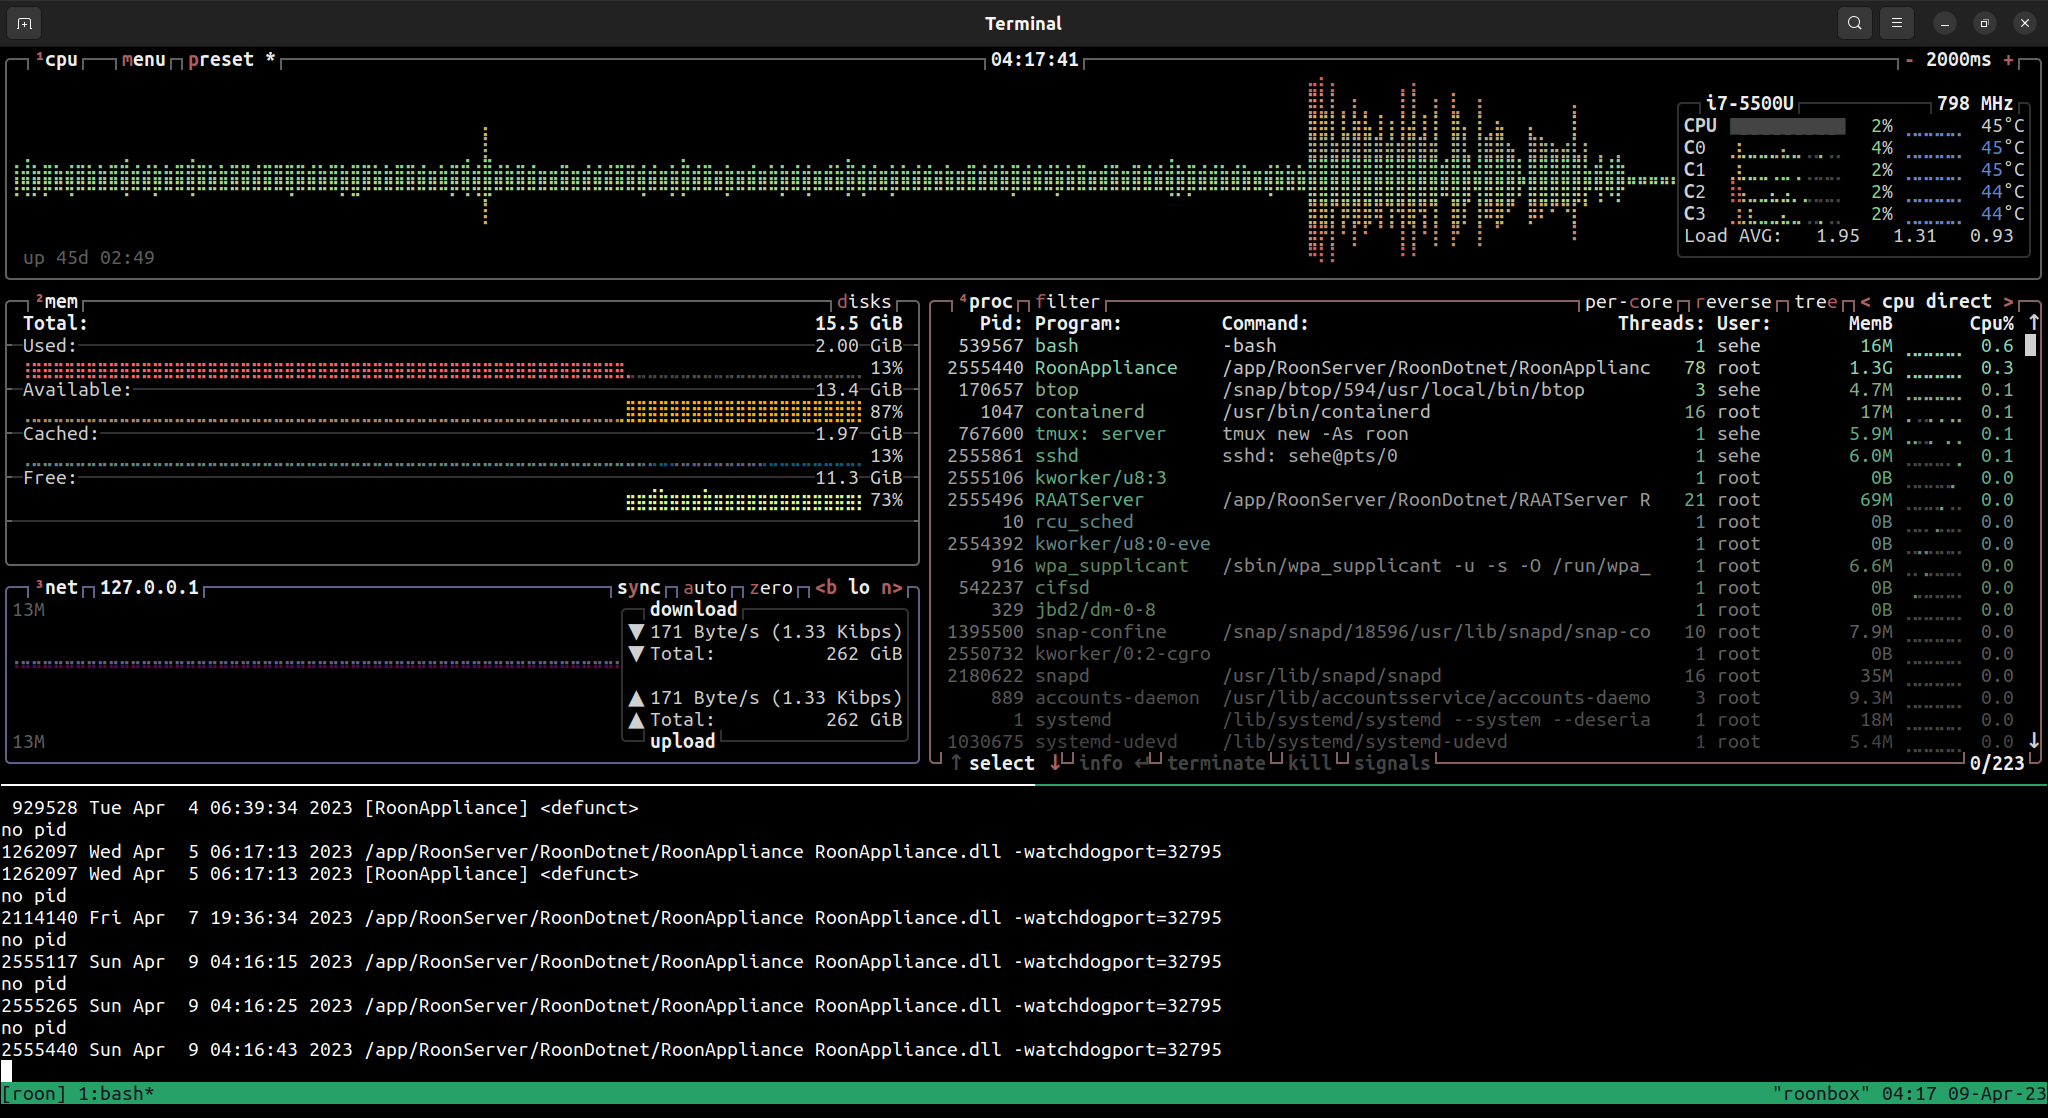
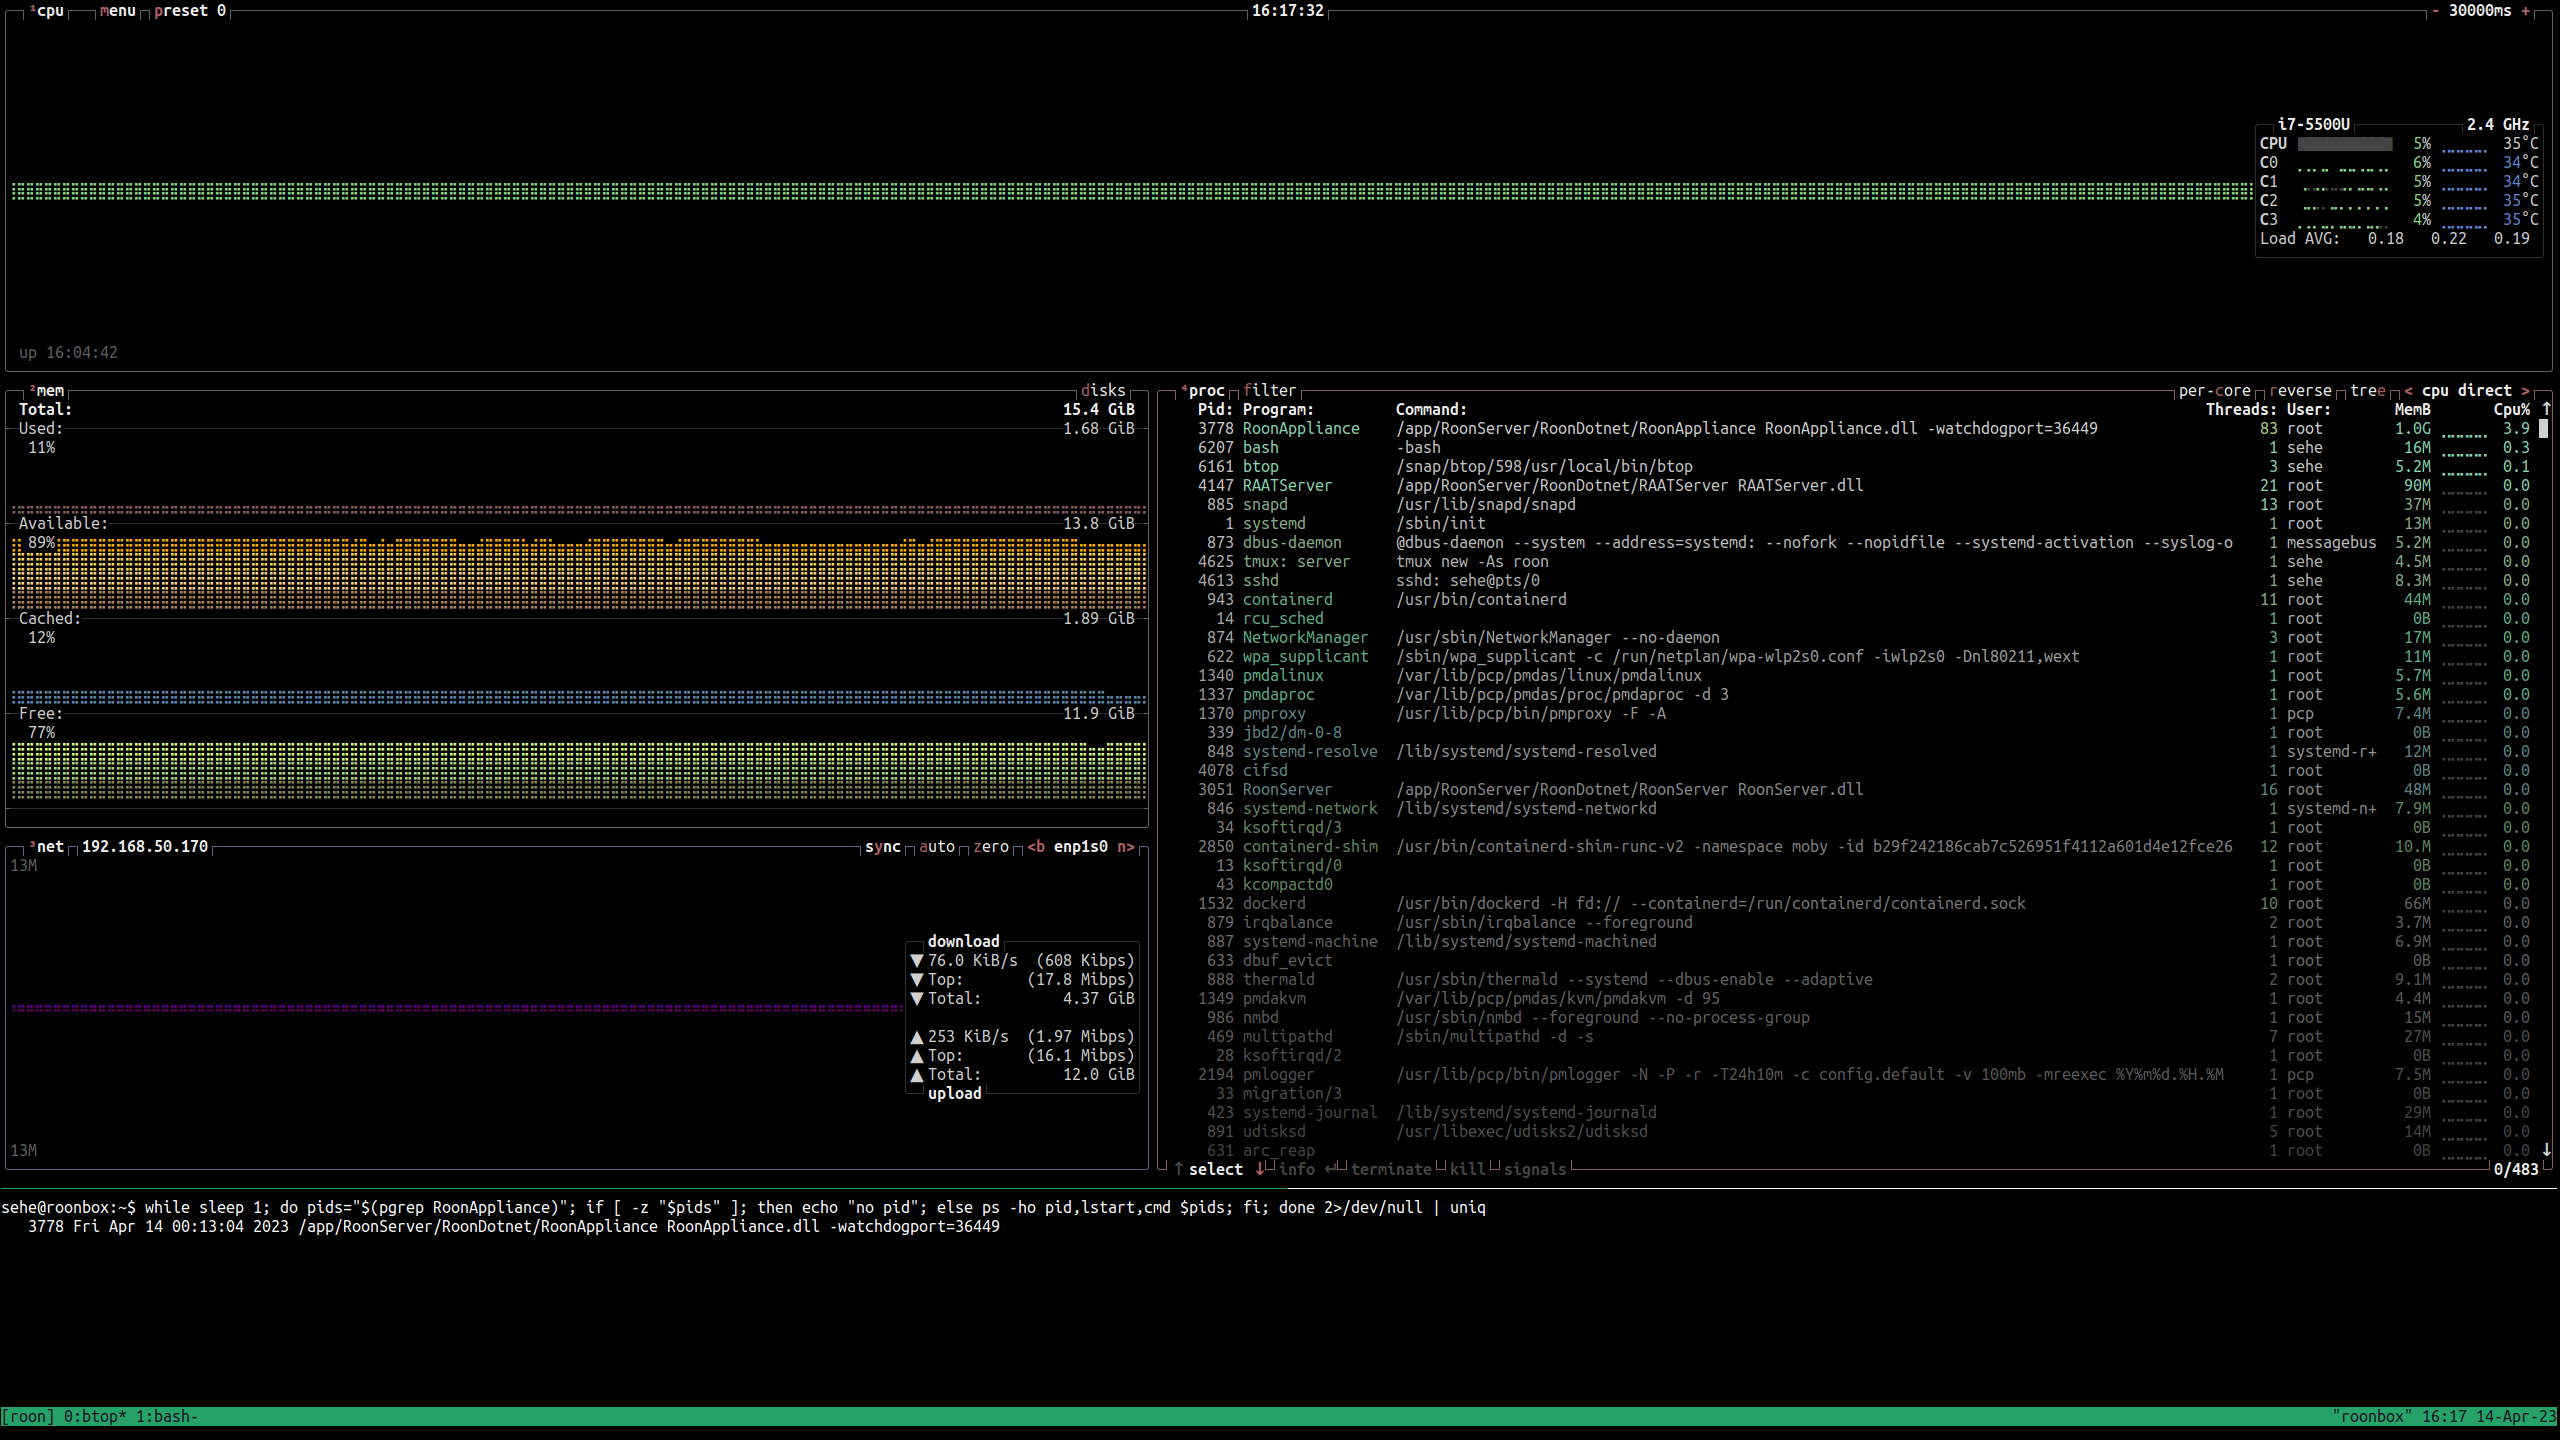
Besides, it is notable that the overall CPU usage is way lower, compare:

My hunch is that the .NET code leaks resources (perhaps a native interface that
doesn’t free all native resources under an IDisposable interface?). After some
while the garbage-collector is gradually stressed more and more, raising CPU
usage and eventually leading to very noticeable stop-the-world cycles.

@S_Heeren, what System OS are you running on your ASUS computer?

Linux. (I had hoped that was kind of obvious from all the hardware info and screencasts)

Linux roonbox 5.4.0-139-generic #156-Ubuntu SMP Fri Jan 20 17:27:18 UTC 2023 x86_64 x86_64 x86_64 GNU/Linux

No LSB modules are available.
Distributor ID: Ubuntu
Description: Ubuntu 20.04.5 LTS
Release: 20.04
Codename: focal

After a day, the server has been apparently functioning normal. However, memory is already accumulating pretty badly:

Also note that without my prompting (no zones were playing any music at the time) there has just been very familiar spike in CPU load in that graph… Something tells me that the system already in the failing state. Perhaps the high CPU episodes are “regular maintenance”, that only breaks operation when memory is very low. At least for now the music continues playing through the CPU episodes. Will keep monitoring

Playback has been mostly fine - with short (sub-2s) cutouts when there was the typical heightened CPU period. However, memory use never rose to the levels seen when I reported the unusable conditions. It still gets pretty high (way more than sensible), but somehow Roon did some restart(s?) autonomously, so I started monitoring for those as well.

The last restart was obviously the 2.0.14 update. That means mem usage is healthy for now:

Things aren’t very stable still.

Every once in a while I get drop outs, and Roon Server crashes/auto-restarts approx. once day. It just happened while I was listening to music. It just stopped, and when I went to look, I could see the server had just spontaneously restarted.

At that time you can see a flurry of high CPU and a sudden drop in memory usage (by about 11.2 GiB)

If you’d like me to do additional investigation to see what’s actually causing this to keep happening, let me know.

1 Like

I am tagging @support for assistance.

1 Like

Hi @S_Heeren ,

Thanks for your very detailed report here. I activated diagnostics mode for your account and I’m looking over the logging. It looks like when you have issue with playback, it is due to poor network conditions, please see the snippets below:

04/08 06:00:12 Warn: [easyhttp] [1957] Get https://www.qobuz.com/api.json/0.2/track/getFileUrl?format_id=27&intent=stream&request_sig=26db2966d9e85db0000f3e79f718ba49&request_ts=1680926405&track_id=42347704 web exception without response: No route to host (99.80.75.9:443) No route to host (99.80.75.9:443)
04/08 06:00:12 Warn: [easyhttp] [1963] Get https://api.roonlabs.net/metadatatext/1/blobs?objectId=124:0:MC0002357429&type=description&sourceLangs=Rovi-albums:en,Wikipedia:en,Rovi-artists:en,Rovi-compositions:en,Wikipedia:nl&c=qobuz-nl&contentPreferences=preferQobuz,avoidMqa web exception without response: No route to host (104.22.14.70:443) No route to host (104.22.14.70:443)
04/08 06:00:12 Warn: [easyhttp] [1961] Get https://api.roonlabs.net/metadata/1/albums/200:0:0002894354672/tracks?c=qobuz-nl web exception without response: No route to host (104.22.14.70:443) No route to host (104.22.14.70:443)
04/08 06:00:12 Warn: [easyhttp] [1955] Post https://www.qobuz.com/api.json/0.2/track/reportStreamingEnd? web exception without response: No route to host (99.80.75.9:443) No route to host (99.80.75.9:443)
04/08 06:00:12 Warn: [easyhttp] [1962] Get https://api.roonlabs.net/metadata/1/albums/200:0:0002894354672/credits?c=qobuz-nl web exception without response: No route to host (104.22.14.70:443) No route to host (104.22.14.70:443)
04/08 06:00:12 Warn: [easyhttp] [1956] Get https://www.qobuz.com/api.json/0.2/track/getFileUrl?format_id=27&intent=stream&request_sig=6f0d3148b38e99abbb34d33d585f4ffb&request_ts=1680926405&track_id=4150160 web exception without response: No route to host (99.80.75.9:443) No route to host (99.80.75.9:443)
04/08 06:00:12 Warn: [qobuz] [http] error result from http request: System.Net.WebException: No route to host (99.80.75.9:443)
 ---> System.Net.Http.HttpRequestException: No route to host (99.80.75.9:443)

It looks like something causes the entire network to drop, and I suspect that these network calls failing is triggering errors and an increased CPU activity as a byproduct.

Looking over your logs further, it also appears that Roon does not have enough bandwidth to download tracks most times, I can see over 85 instances in your logs this month where the network speed is not adequate, for example:

	Line  3028: 04/08 17:04:47 Warn: FTMSI-B-OE qo/352680EF: poor connection kbps:1280.0 (min:3631.0)
	Line 14952: 04/08 19:46:44 Warn: FTMSI-B-OE qo/2A077997: poor connection kbps:4000.0 (min:4019.0)
	Line 16196: 04/08 19:54:30 Warn: FTMSI-B-OE qo/37B43B30: poor connection kbps:2653.5 (min:4019.0)
	Line 21044: 04/08 20:55:14 Warn: FTMSI-B-OE qo/3E5C9A23: poor connection kbps:5069.0 (min:6083.0)
	Line 27354: 04/08 21:33:17 Warn: FTMSI-B-OE qo/7E0A71B6: poor connection kbps:1023.0 (min:3710.0)
	Line 30300: 04/08 23:00:04 Warn: FTMSI-B-OE qo/96EEE4F0: poor connection kbps:2699.0 (min:3647.0)

When you are using Roon, do you have your WiFi interface disabled? It’s strange that you are getting these poor speeds in the logs when you have a gigabit connection.

@noris Thanks for the thoughtful analysis.

I didn’t look at logs myself (don’t really know where to look). The “No route to host” seems mystifying. Nothing on my network seems unstable, especially on the wired network.

NOTE Though there are scheduled router daily restarts at 4:30am local time, so any connectivity issues are to be expected at that time (for about 2 minutes)

I did not have the WiFi disabled. I rather like that I can move the equipment around without interrupting the operation. Even so, the WiFi should be more than enough (we have three WiFi 5 access points on 150m²). I’ll disable the wifi though, just to be sure. (It’s been a long time since I actually disconnected any equipment).

(On a tangent I checked that I can detect when the wired link goes down physically from the syslog; I can, and it doesn’t appear to have occurred over the last week, except for my experiment just now)

I also wonder what explains the excessive memory use. Just now it clocks in at 8.5GiB for RoonAppliance. It really does seem like the problem of sluggish track changes always exists to some degree. I can confirm that the “early signs of stress” seemed to coincide with track switches, which typically show a peak in download activity. I assume this is because Roon fetches the entire track at the start. (I’ve seen it reported on this forum by other people too, I think). There seems to be a connection between the amount of memory used and the extent of disruption. For it to become unwieldy is rare, but that may be slightly offset because my roon core isn’t under-powered :slight_smile:

Could it be something counter-intuitive? Like, precisely the high-speed connection and CPU cause downloads to go at a rate that either exceeds limits (e.g that Qobuz will accept, or just taxes the CPU) or hits edge cases in resource management leading to resource leaks?

I might look at throttling the network link to test this hypothesis. For now I took the opportunity to upgrade my Ubuntu distribution, and disabled WiFi for good measure. After a reboot RoonAppliance is back to a healthy 1.3GiB. Let’s just monitor it from here.

Well whaddayaknow. Memory use is way down

And ~12 hours down the road

I haven’t seen the system so stable in a long time.

I’m beginning to hope some Ubuntu upgrade or just the fact that I physically rebooted¹ the machine fixed it (¹… It hadn’t been in 49 days).

Well. It’s been 5 days to the minute, and I’ve seen only a single restart, which was yesterday’s update, so effectively perfect uptime. Just look at the flat memory, network, CPU profiles.

Honestly, it bugs me that I don’t know what caused the problems/how, but I’ll mark this as solved. The most notable change(s) were that I updated the host OS (to ubuntu 22.04 LTS) and in the process did a reboot. A notable quirk was that during update/reboot there were ominous messages about systemd not functioning completely. Grasping at straws, but of the good kind because it’s to explain solutions, not problems :slight_smile:

UPDATE 12d of rock solid. Amazing :slight_smile:

2 Likes

This topic was automatically closed 36 hours after the last reply. New replies are no longer allowed.