Let’s start with observing that since Apr 12 the system has been running very satisfactory. So much so that I stopped actively monitoring the Roon core.
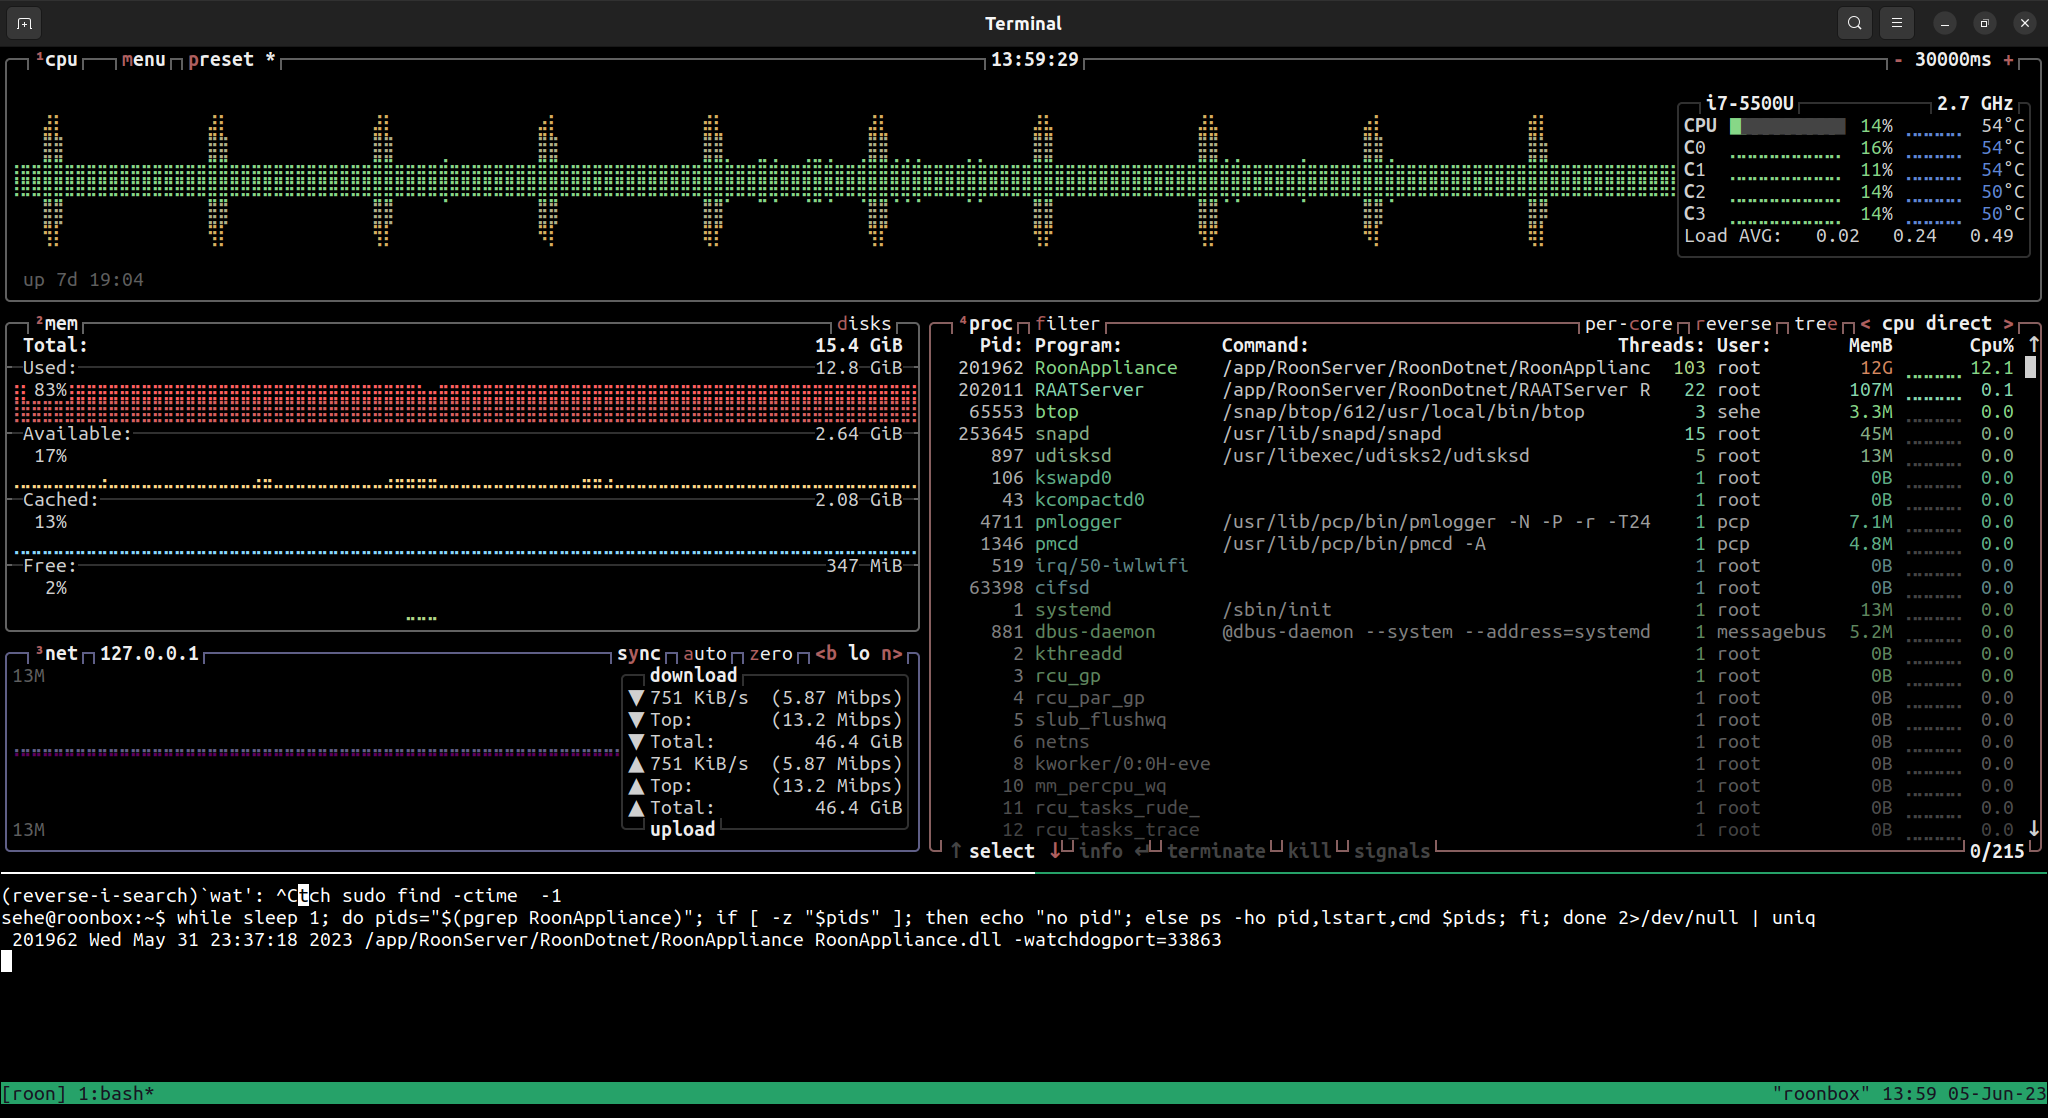
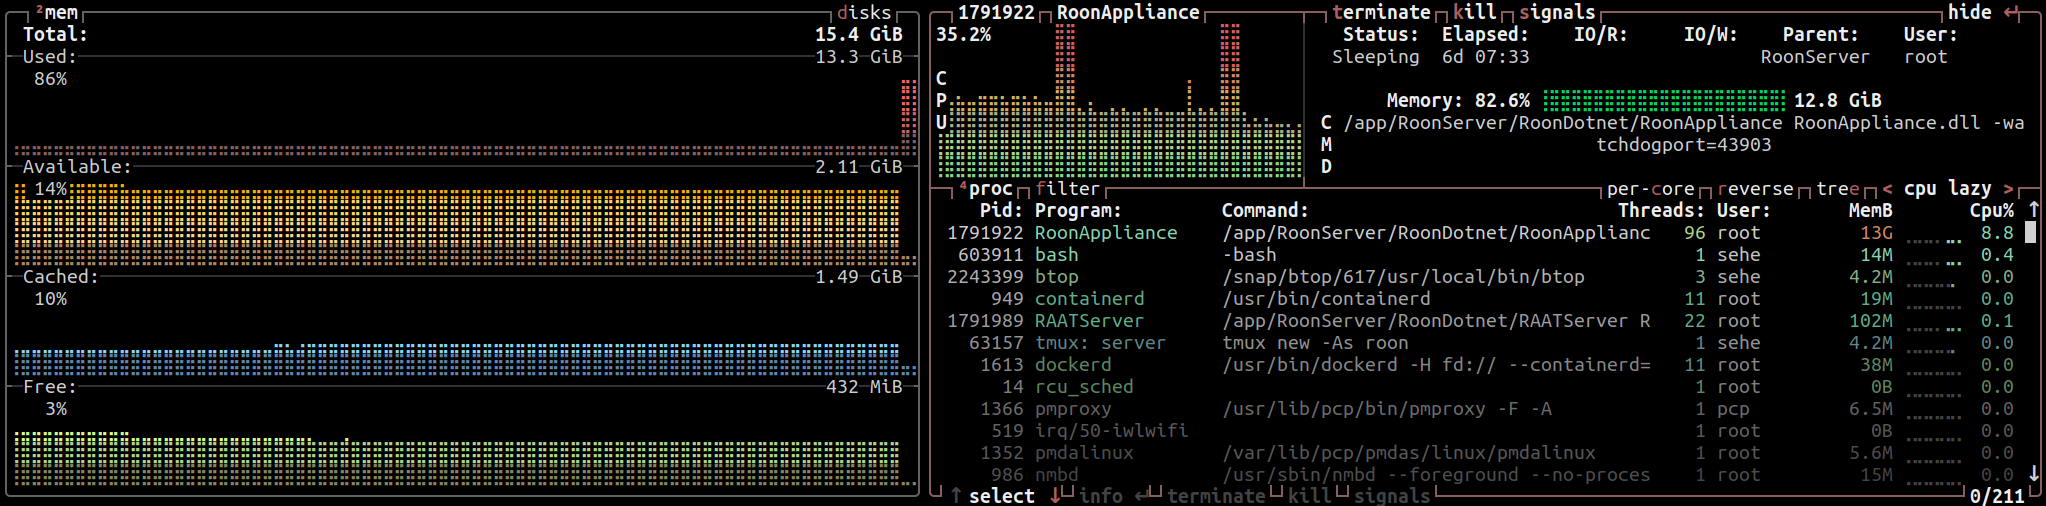
Today, playback got stuck for ~2 minutes in ordinary use. Looking, memory usage is once again extremely high: 12G (!!!) has not happened for weeks (when I was still actively monitoring it fluctuated beteen 0.8-2G tops). This is a screenshot short time after it happened,
Note also the periodic high-CPU blips (the time scale is way zoomed out with one “pixel” representing 5 minutes).
Nothing changed (outside uneventful Roon self updates). Wifi is stil disabled. @noris Anything I can dive into to help you get a handle on this evasive one?
It just happened again. Difference this time was that I had had my music paused for a small while, and “caught” a stuck spell trying to play back. It had the heart-stopping effect of starting playback after roughly a minute when I had already forgotten I had tried to get it to start.
Memory usage was still 12G at the time with no sign of letting up. I’m going to restart the service right now to see whether it will still reoccur.
Same here. Getting massive RAM useage (9-12GB or more) and dropouts (on Windows though). Reported this two weeks ago but so far no response from Support. I’m getting flashbacks to when this was happening awhile back and was fixed.
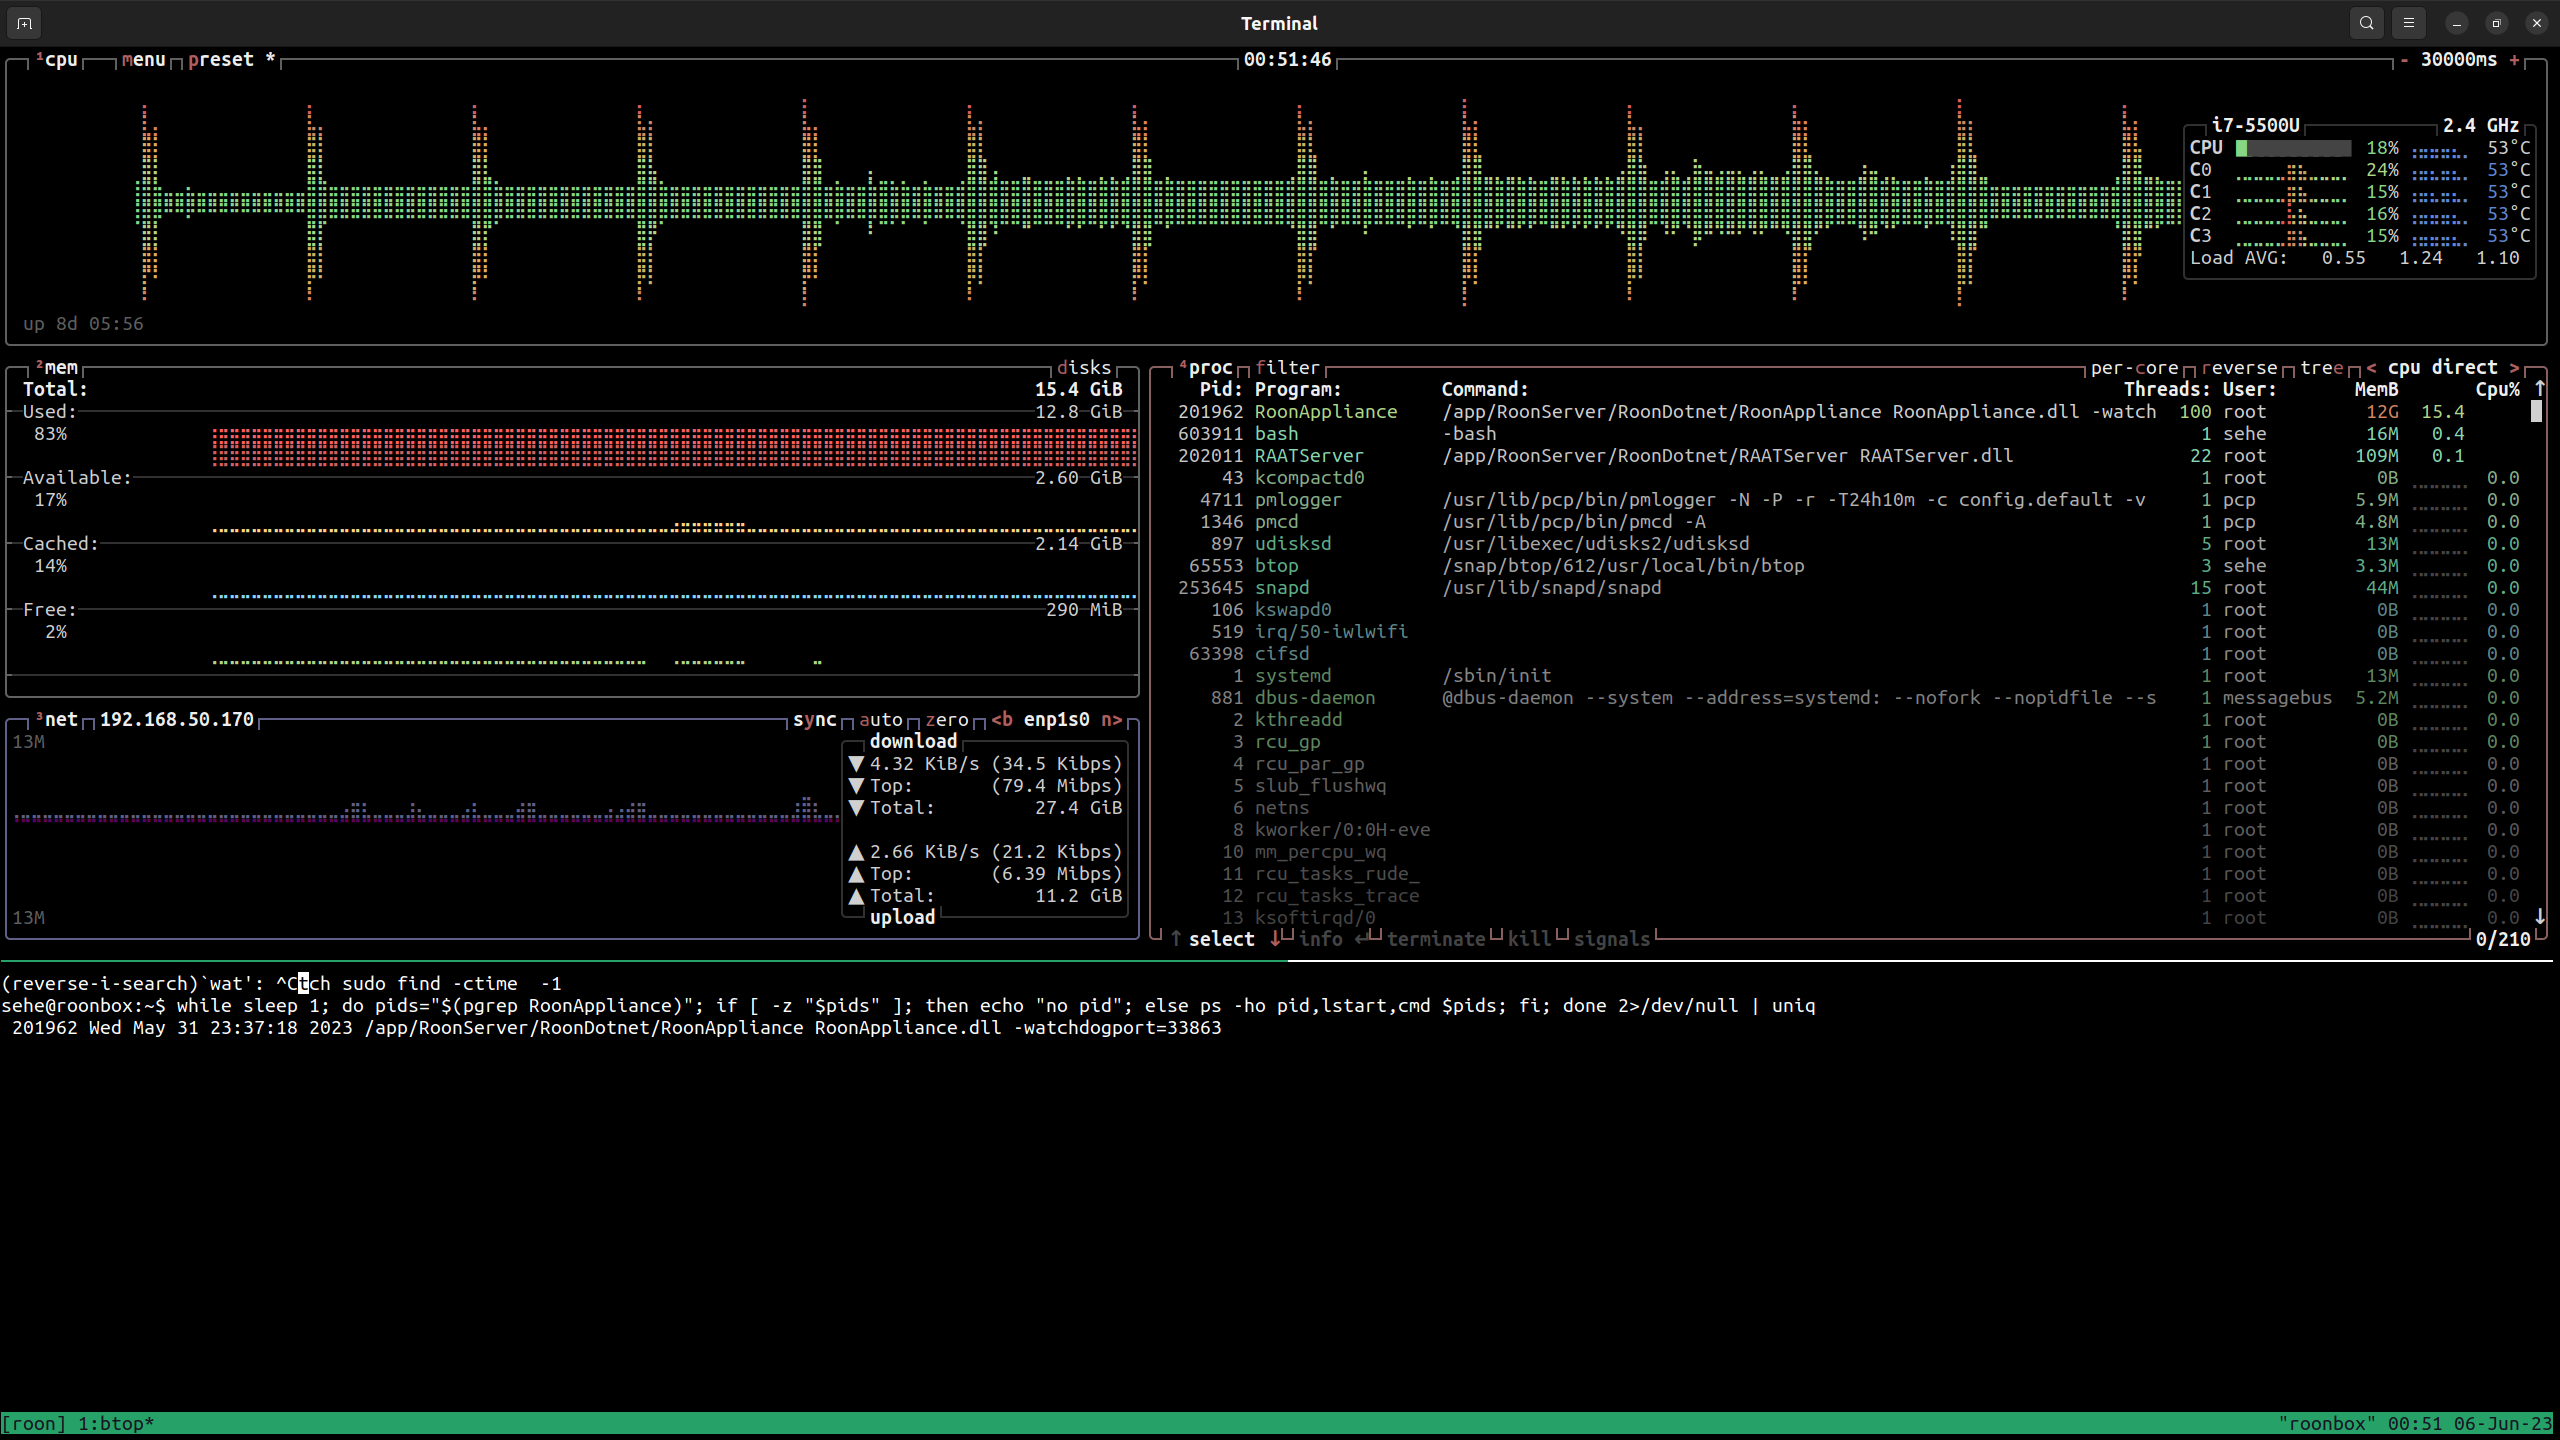
It went away after I updated my OS and everything got restarted. But now it magically appears to be back. I’m thinking there’s a “rare condition” that causes this, and that’s all there is to it. Meanwhile, you can see the stark difference since I restarted the service ~20 minutes ago:
I could monitor by proxy just by using a thermometer above the Asus Mini unit.
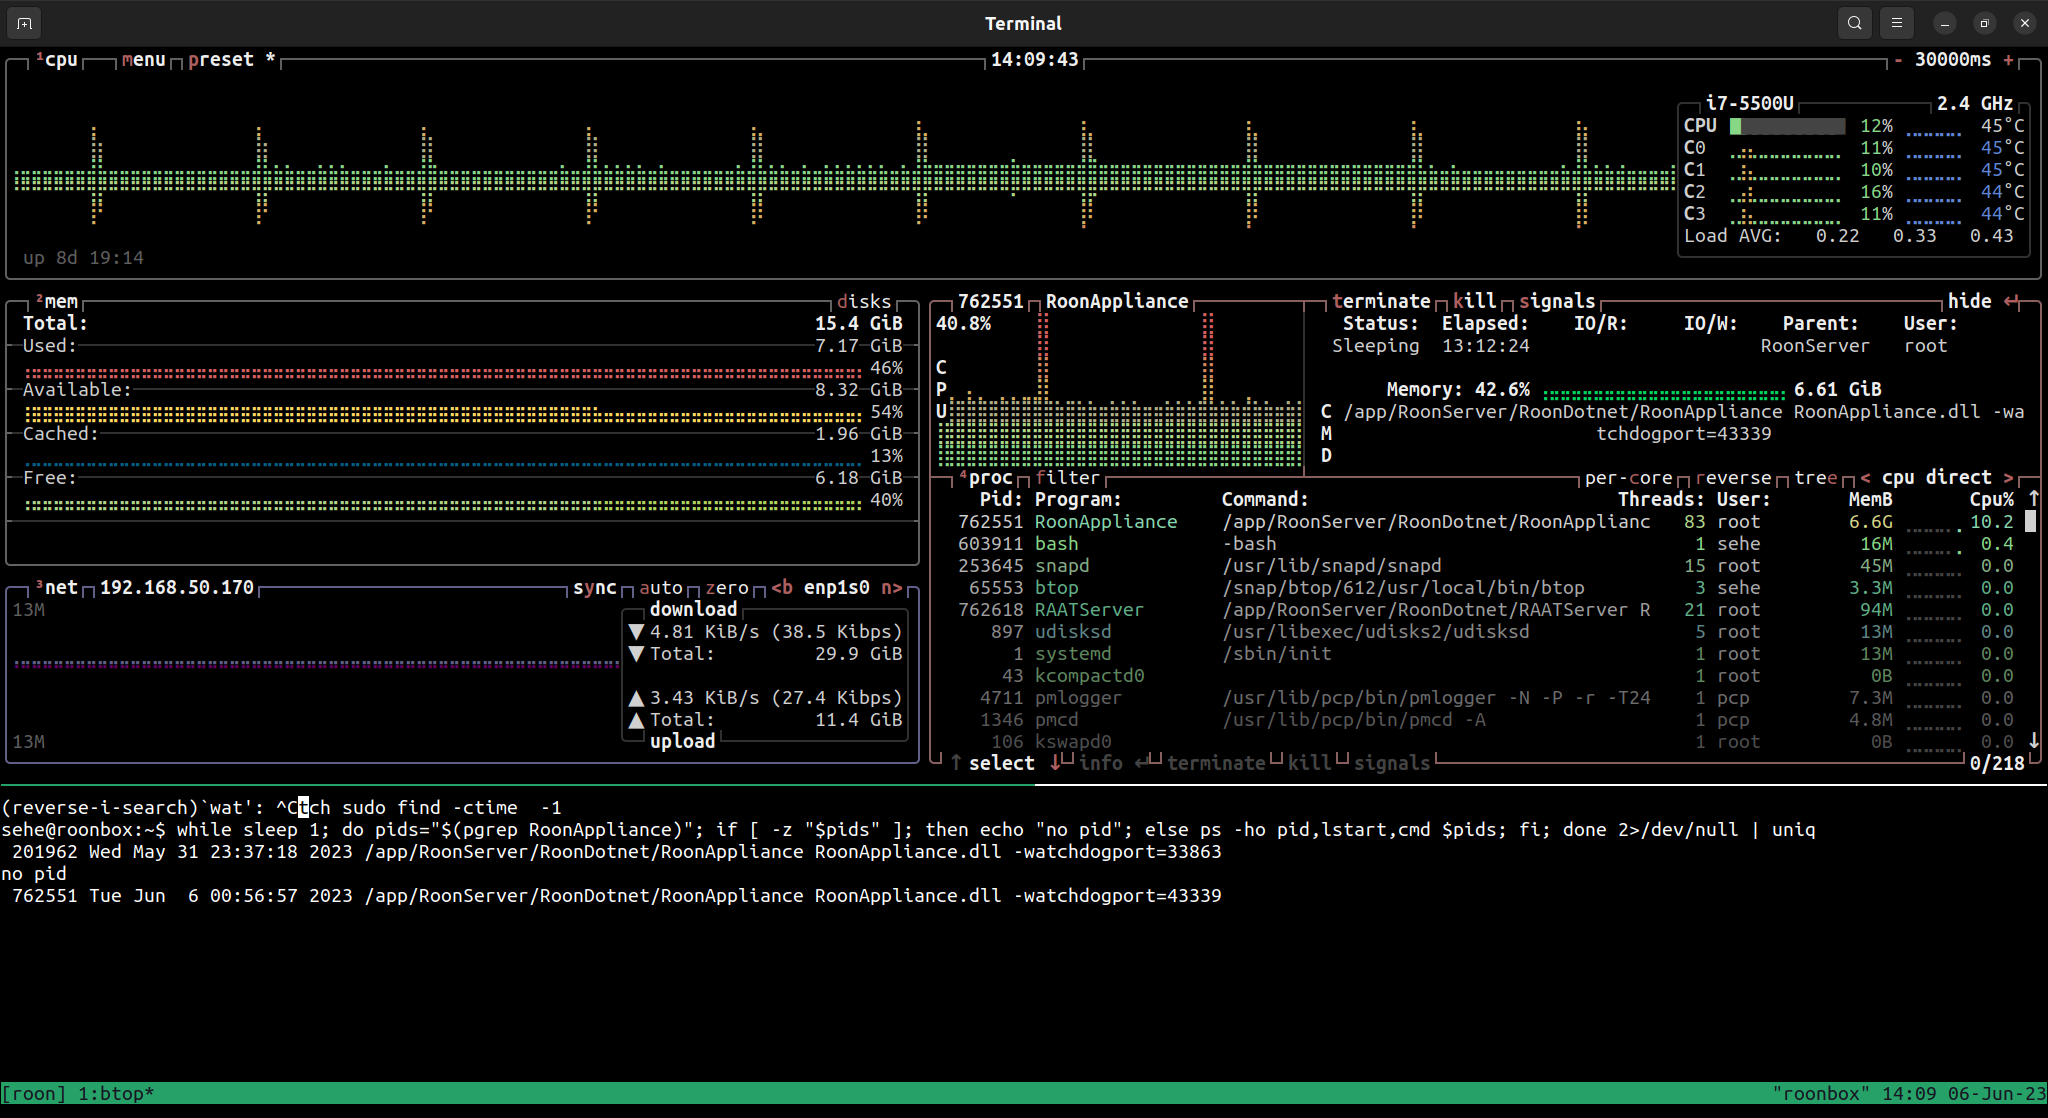
UPDATE ~30 minutes later: 6.9G
Another hour later 7.5G
Since then I saw it rise to 9G, interesting dipping slightly to 8.2G, but by now it arrived at 12G, so there is still a strong trend. I’m wondering whether closing the desktop app helps stemming the leak. I’ll try that now for a while
So, memory growth has leveled off somewhat around 12.7GiB
However, still I get occasional 2-minute chokes after which I manually have to restart playback.
Also, I don’t like that the heightened CPU load is causing my unit to run at 70℃ continuously. So I’m going to restart things again. This is not stable by any stretch of imagination.
Today just before applying the software update the server was running at 12GiB (slightly lower in CPU, so “only” 60℃ at this time). This does imply that keeping the desktop UI closed for the majority of the time doesn’t actually prevent the RAM build-up.
Let’s see how long it takes to grow this time. Any input/requested info, /cc @noris?
Apologies for the slow response here. I activated diagnostics for your Roon Core and saw lots of network reachability changed traces, which may be causing this behavior, for example:
    Line   451: 06/13 04:30:34 Trace: [broker/accounts] network reachability changed. refreshing
	Line   460: 06/13 04:30:34 Debug: [tidal] network reachability changed. refreshing token
	Line   461: 06/13 04:30:34 Trace: [roonapi] network reachability changed. Kicking off discovery cycle
Are you by any chance making use of IPv6 in your setup? Please see this related thread:
@noris I’m not /using IPV6 but it is enabled by default on any modern OS. I’ve disabled it to see whether it makes a difference (also restarted the server).
I’d like to note that a software bug is causing the behavior, regardless. It may be a bug that manifests when IPV6 is present/is triggered by it, but it’s clearly a resource leak issue nonetheless.
By the way, is that from my log?! I don’t use Tidal. ¯\(ツ)/¯
I’ll read up on the other thread so I can catch up with thinking by others and maybe generate extra idea’s/information. Cheers
For now it doesn’t make any visible difference. Memory still up by 8G and the unit slowly starting to heat up the room (which is impressive given the ambient temperatures).
I’ll keep using to see whether it makes any difference in terms of dropping/blocking playback.
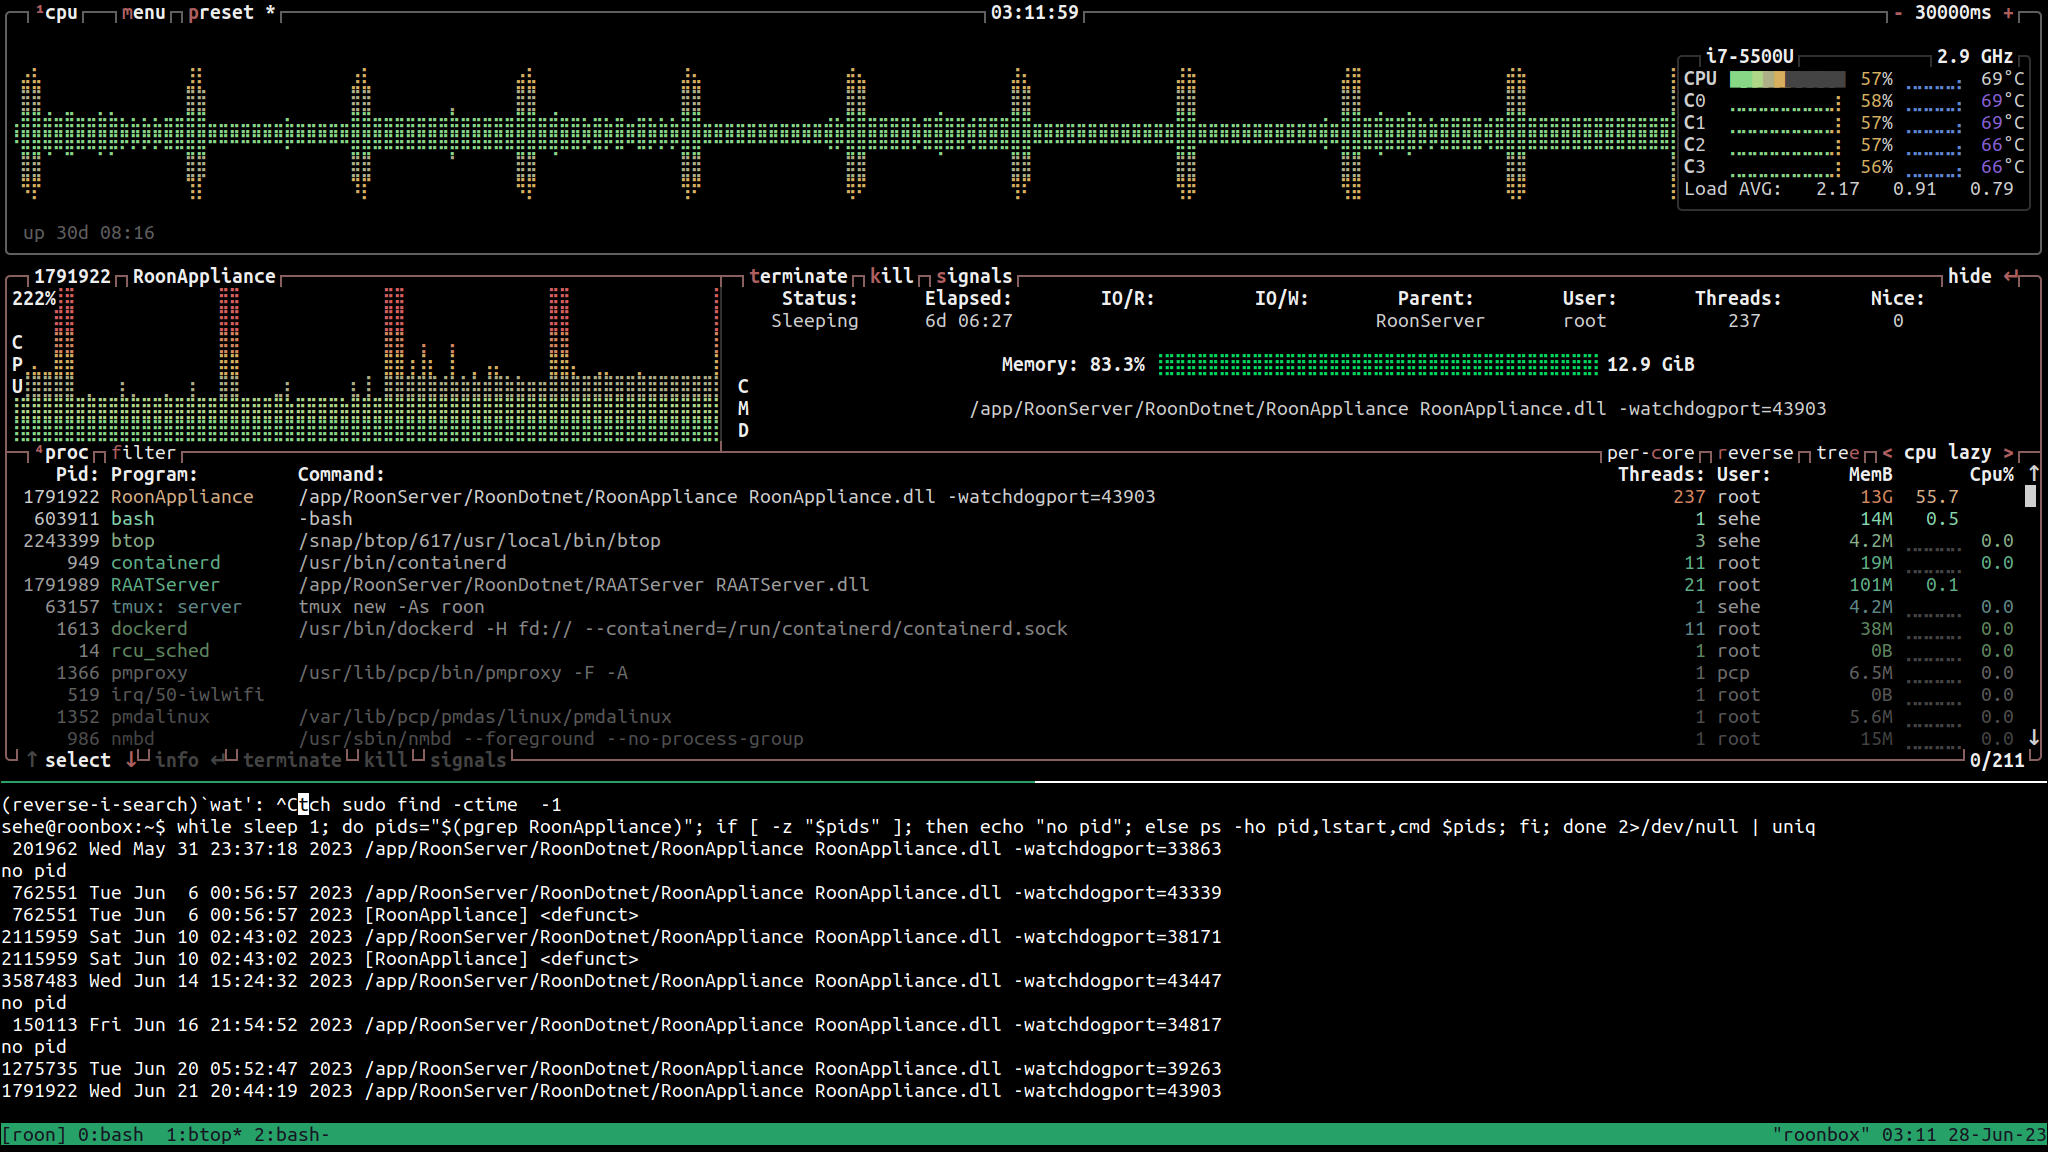
Sadly it’s back to dropping out even with ipv6 disabled.
It’s always the same CPU peak patterns and high RAM usage.
Base idle CPU is much lower when RAM is still low, but after time base CPU usage when idle becomes 20% on all cores and it heats up the room steadily. At the peaks, the load is considerably higher as shown.
EDIT So, after yet another 2-minute stall-out I caved and restarted the Roon service. I’m pretty sure it will only get (much) worse. It’s not even using all the RAM, so RAM exhaustion itself is probably not the problem. Only 82% of total RAM in use, plenty free (especially considering the 1.49 GiG of block cache, which is essentially free to use)
Ironically, it takes far less time for the music to resume playing when restarting the service than when waiting for it to come out of its stalled situation.
@Fernando_Pereira There is no doubt something specific (also known as a cause or a trigger). I’d say it’s not likely “very specific” as that is contradicted by the sheer number of people reporting the issue (on both windows and linux). Considering the tip-of-the-iceberg phenomenon in user reports, I’d guess it’s actually pretty common.
Regardless you can see exhaustive detail of setup/configuration over on my earlier report from March. I have since disabled WiFi and ipv6 to little avail. It’s interesting that the stalling problems seemingly didn’t manifest for a considerable while, enough to lead me to stop actively monitoring. There has not been a corresponding change in configuration or usage patterns that can I can think of to explain the recurrence.
Not sure I agree. My guess is that there are a couple dozen such reports, a very small fraction of Windows and Linux users. But having been the subject of a rare but extremely hard to debug Roon issue several years ago, I understand the frustration.
@Fernando_Pereira Cheers! I think I’m doing fine frustration wise. Just trying to help Roon devs get to the bottom of this, as I realize very few non-techie people will have the stamina to go through this process.
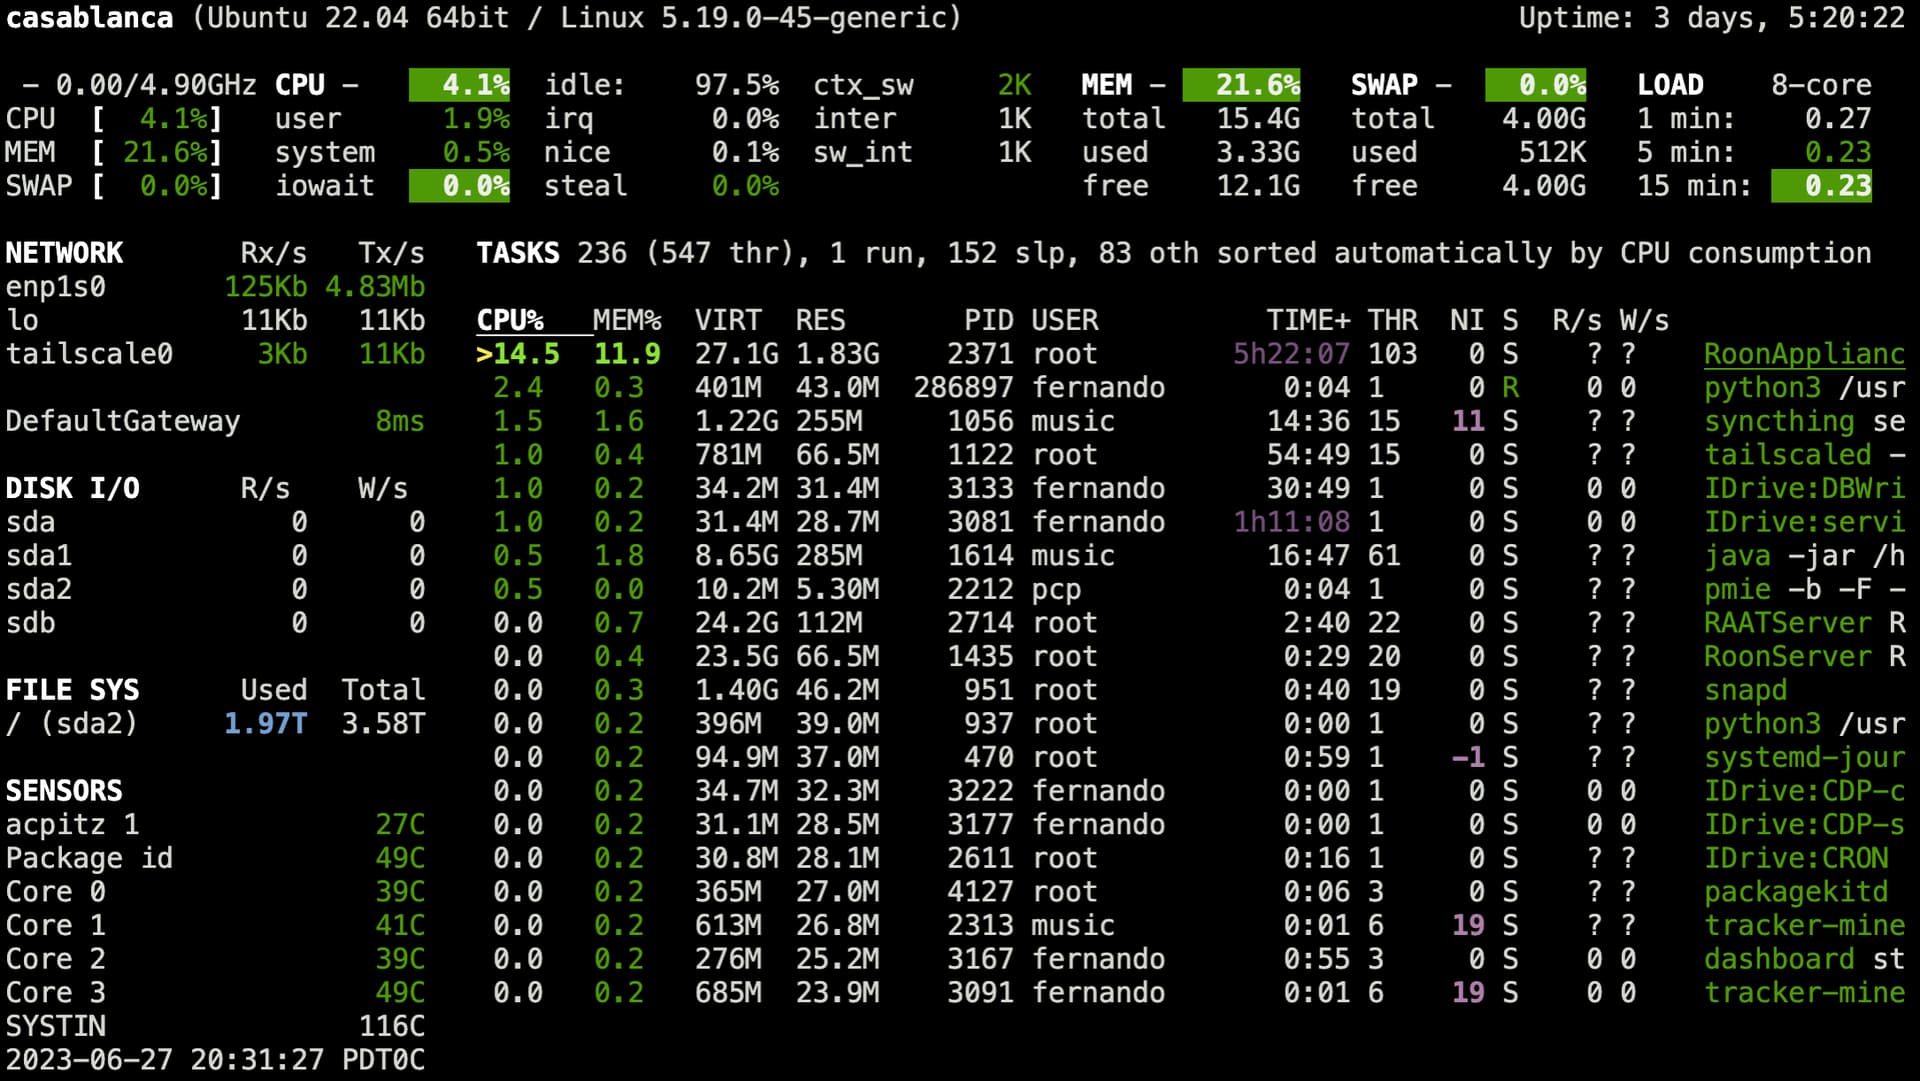
@Robem The system should not swap at all, as there’s ample free space at all times. The box has 16 GiB. Regardless I’ve enabled swap display just in case it shows something next time. In fact most of my linux machines have swap completely disabled (no swap disk at all), so it’s a good call to check because I forgot this installation used the default. It’s definitely in my original description because I used diagnostics tools to list all the system information
Here’s what it looks like right now, keeping in mind this after having “just” restarted the Roon service:
I had very similar symptoms as you do that plagued me on and off for a few years through multiple distros. I thought that the dot net changes that were implemented a while back resolved the issue but the ballooning memory crept back and disconnects started again. I think I’ve finally nailed it by setting the vm swappiness parameter to zero. It’s actually behaving like I would expect a server to now. I’m running on Debian Bookworm right now.
Swappiness is set to the default 60 on my two Ubuntu Server machines on two different locations, and yet I don’t have the memory bloat issue on either one. Re the network reachability warnings that @noris noticed, have you looked to see if they coincide with something reported on syslog? Reason I’m asking is that I had a recent issue on my HQPlayer server where play irregularities were eventually traced to brief network connectivity losses from a flaky Ethernet patch cable.